[List of Test Results Collected with EUC Score Experiments]
Microsoft Remote Desktops
Benchmarking different aspects of Microsoft remote desktop infrastructure and the RDP protocol, both on premises and in the cloud. The test results presented here are a subset of the complete data sets collected during multiple Remote Desktop Session Host, Azure Virtual Desktop, and Windows 365 test sequences.
- Windows 365 Enterprise GPU Super
- FSLogix Profiles on Azure Files versus Azure NetApp Files
- AVD D8ads v5 versus Windows 365 Business Cloud PC
- Lancelot versus Windows 365 Business Cloud PC
- RDP-TCP versus RDP Shortpath (no GPU)
- RDP-TCP versus RDP Shortpath (M60 GPU)
- Lancelot without GPU versus AVD D8ads v5
- Lancelot with M5000 GPU versus AVD NV4as v4
- Lancelot with M5000 GPU versus AVD NV6
- AVD NCasT4 v3 with NVIDIA Tesla T4 GPU
- Examples of Incompatible Use Cases: AVD D8ads v5 without GPU
If you want to learn how the EUC Score results were produced then check out EUC Score Test Methodology and EUC Score Toolset.
Windows 365 Enterprise GPU Super
 Test Engineer: Benny Tritsch
Date of test: 14-15 October 2024
Test Engineer: Benny Tritsch
Date of test: 14-15 October 2024
Test Goal
Show the performance impact that different network conditions have on Windows 365 Enterprise GPU Super VMs. The reference on the left (yellow) side is always 100mbps bandwidth, 10ms latency, 0% packet loss. On the right (red) side, option [1] limits the bandwidth to 8mbps, option [2] adds 100ms latency (110ms in total), and option [3] adds 2% packet loss.
Selected Sync Player Clips
| Simload | Links | Observation | |
|---|---|---|---|
|
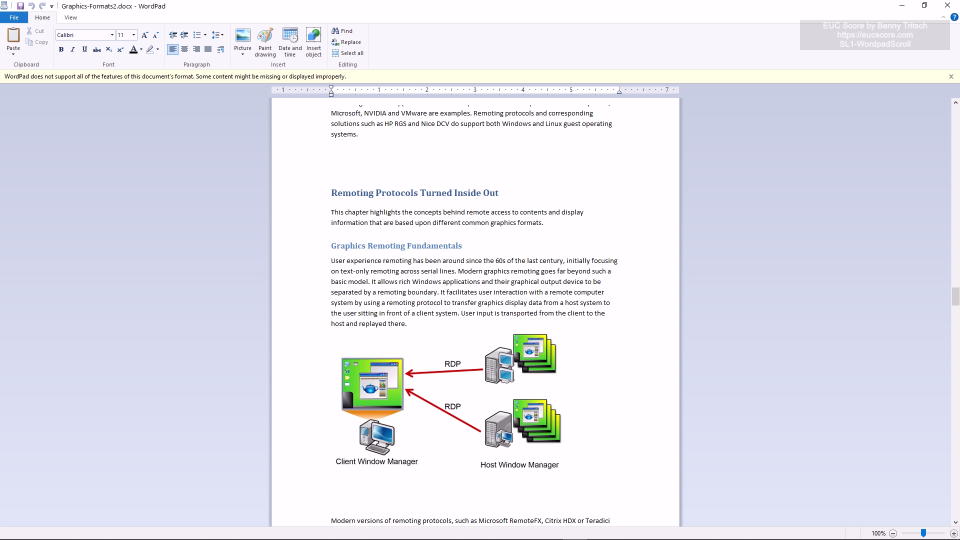
SL1-WordpadScroll | [1] 100mbps vs 8mbps [2] 10ms vs 110ms [3] 0% vs 2% Loss |
Noticeable performance impact when packet loss rate is 2%. |
|
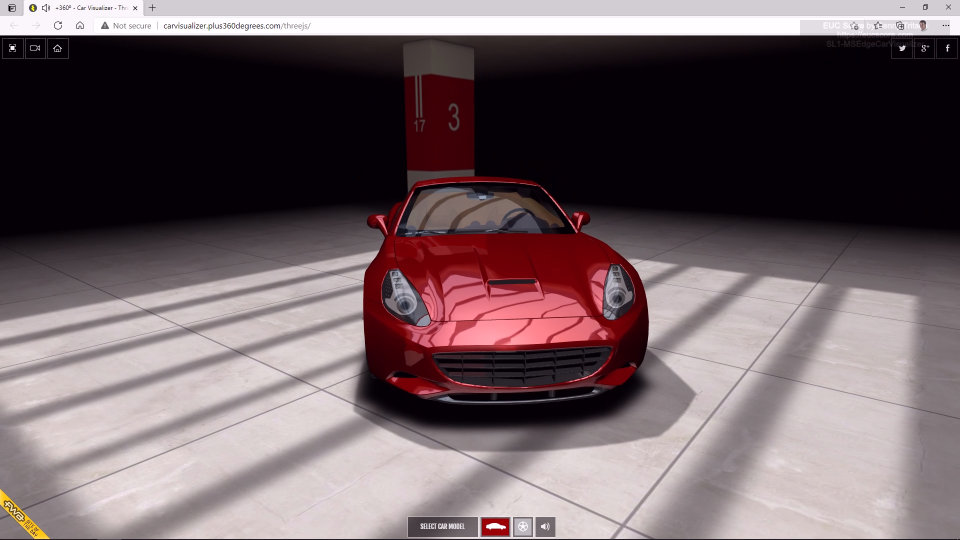
SL1-MSEdgeCarVisualizer | [1] 100mbps vs 8mbps [2] 10ms vs 110ms [3] 0% vs 2% Loss |
The output shows significant stuttering when the packet loss rate is 2%. |
|
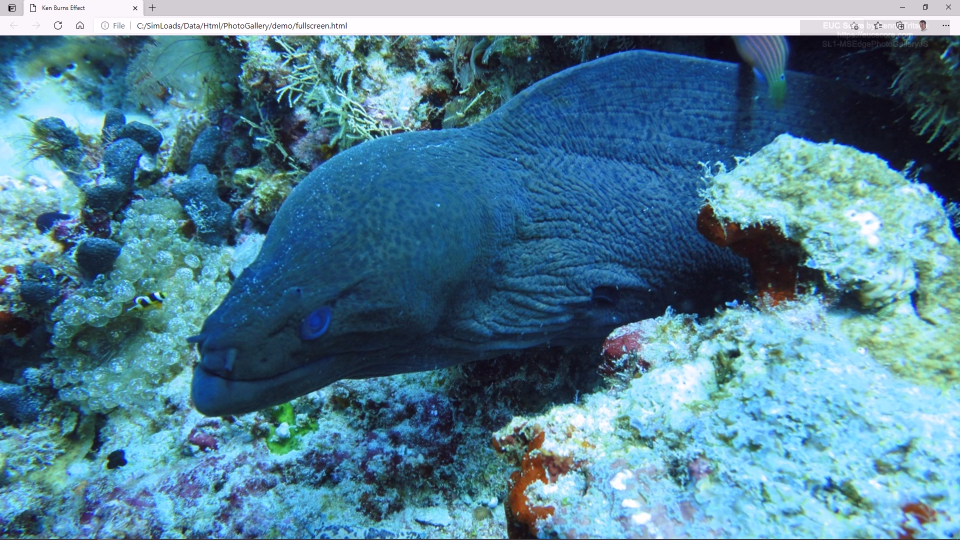
SL1-MSEdgePhotoGalleryJS | [1] 100mbps vs 8mbps [2] 10ms vs 110ms [3] 0% vs 2% Loss |
All network limitations have a negative impact on performance, especially the 2% packet loss rate. |
|
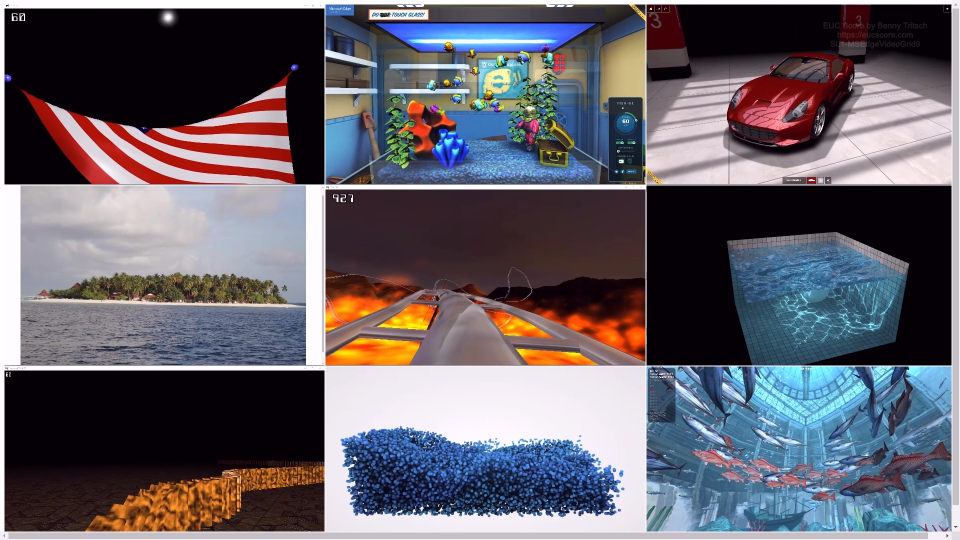
SL1-MSEdgeVideoGrid9 | [1] 100mbps vs 8mbps [2] 10ms vs 110ms [3] 0% vs 2% Loss |
All network limitations have a more or less negative impact on performance, especially the 2% packet loss rate. |
|
SL1-DominoOpenGL | [1] 100mbps vs 8mbps [2] 10ms vs 110ms [3] 0% vs 2% Loss |
Graphics performance is outstanding, only a packet loss rate of 2% shows significant stuttering. |
|
SL1-Plot3dOpenGL | [1] 100mbps vs 8mbps [2] 10ms vs 110ms [3] 0% vs 2% Loss |
All network limitations have a negative impact on the performance of this very demanding graphics Simload. |

|
SL1-TessMarkOpenGL | [1] 100mbps vs 8mbps [2] 10ms vs 110ms [3] 0% vs 2% Loss |
All network limitations have a more or less negative impact on performance. |
Summary of Test Observations
The Windows 365 Enterprise GPU Super VM shows outstanding performance and user experience under good network conditions. Network restrictions change the picture especially for graphics intensive Simloads. The greatest negative impact on performance can be observed at a packet loss rate of 2%.
Test Setup Details
Windows 365 GPU Super
Windows 365 GPU Super w/ Network Limits
System Under Test: Azure Germany West Central, Windows 365 Enterprise GPU Super, AVC444 High Image Quality, Windows 11, AMD EPYC 74F3 18vCPUs @ 3.2GHz, 220GB RAM, 1000GB Microsoft Virtual Disk, NVIDIA A10-12Q GPU, Remote Desktop Services SxS Network Stack.
System Under Test: Azure Germany West Central, Windows 365 Enterprise GPU Super, AVC444 High Image Quality, Windows 11, AMD EPYC 74F3 18vCPUs @ 3.2GHz, 220GB RAM, 1000GB Microsoft Virtual Disk, NVIDIA A10-12Q GPU, Remote Desktop Services SxS Network Stack.
Connection: SxS RDP-UDP, 100mbps bandwidth, 10ms latency, 0% packet loss.
Connection: SxS RDP-UDP. [1] 8mbps bandwidth limit, [2] additional 100ms latency, [3] 2% packet loss.
Endpoint: NUC2, Intel NUC 8i7HNK with Windows 11, i7-8705G CPU @ 3.10GHz, 16GB RAM, 500GB Samsung SSD 850 EVO M.2, AMD Radeon RX Vega M GL, 4GB VRAM, Windows App 1.3.272.0.
Endpoint: NUC2, Intel NUC 8i7HNK with Windows 11, i7-8705G CPU @ 3.10GHz, 16GB RAM, 500GB Samsung SSD 850 EVO M.2, AMD Radeon RX Vega M GL, 4GB VRAM, Windows App 1.3.272.0.
FSLogix Profiles on Azure Files versus Azure NetApp Files
Test Engineer: Benny Tritsch
Date of test: 8 January 2024
Test Goal
Compare FSLogix stored on Azure Files versus Azure NetApp Files, both on identical Azure VM types and monitored with ControlUp.
Selected Sync Player Clips
| Simload and Link | View and Type | Observation | |
|---|---|---|---|

|
SL3-UserProfileLarge | Side-by-Side View Disk Read/Write |
"User Profile Large" Simload, running for 3 minutes on identical Azure VM types and monitored with ControlUp. Azure Files Score: 9.31, Azure NetApp Files Score: 7.99. |
Summary of Test Observations
FSLogix Profile on Azure NetApp Files (ANF) shows a score that is about 15% lower (= better) compared to FSLogix Profile on Azure Files. Further optimization may lead to much better performance on the ANF side.
Test Setup Details
FSlogix Profile on Azure Files
FSlogix Profile on Azure NetApp Files
System Under Test: Azure West Europe, Windows 11 Enterprise Multi-User, AMD EPYC 7763 2.4GHz 8vCPUs, 32GB RAM, HDD 126.45GB, no GPU.
System Under Test: Azure West Europe, Windows 11 Enterprise Multi-User, AMD EPYC 7763 2.4GHz 8vCPUs, 32GB RAM, HDD 126.45GB, no GPU.
Connection: SxS RDP-UDP.
Connection: SxS RDP-UDP.
Endpoint: NUC2, Intel NUC 8i7HNK with Windows 11, i7-8705G CPU @ 3.10GHz, 16GB RAM, 500GB Samsung SSD 850 EVO M.2, AMD Radeon RX Vega M GL, 4GB VRAM.
Endpoint: NUC2, Intel NUC 8i7HNK with Windows 11, i7-8705G CPU @ 3.10GHz, 16GB RAM, 500GB Samsung SSD 850 EVO M.2, AMD Radeon RX Vega M GL, 4GB VRAM.
AVD D8ads v5 versus Windows 365 Business Cloud PC
Test Engineer: Benny Tritsch
Date of test: 1 September 2022
Test Goal
Find out if a Windows 365 Business Cloud PC 2vGPU/8GB/128GB can keep up with an AVD D8ads v5 VM.
Selected Sync Player Clips
| Simload and Link | View and Type | Observation | |
|---|---|---|---|
 |
SL1-ChromeGifScroll | SxS View - STD | Almost similar user experience, but significantly higher CPU consumption in Cloud PC session. |
|
SL1-ChromeAquariumWebGL | SxS View - STD | The significantly higher CPU capacity in the AVD D8ds v5 VM type results in better user experience and higher frame rates. |
|
SL1-ChromeFishbowlHTML5 | SxS View - STD | In the Cloud PC session, fish are moving in slow-motion due to limited CPU resources. |
|
SL1-ChromeVideoGrid9 | SxS View - STD | In the Cloud PC session, videos are stuttering due to limited CPU resources. |
|
SL1-MSEdgeWaterWebGL.html | SxS View - STD | In the AVD D8ds v5 session, higher frame rate and better rendering quality due to higher CPU capacity. |
Summary of Test Observations
The Windows 365 Cloud PC with 2 vCPUs cannot keep up with the Azure D8ads v5 VM with 8 vCPUs. But while the price of a Windows 365 Business Cloud PC 2vGPU/8GB/128GB is approx. $40 per user per month, the pay-as-you-go price of a D8ads v5 VM is in the range of $300 per month.
Test Setup Details
D8ads v5
Windows 365 Cloud PC
System Under Test: Azure West Europe, D8ads v5 VM, Windows 11 Enterprise, AMD EPYC 7763 2.4GHz 8vCPUs, 32GB RAM, HDD 126.45GB, no GPU.
System Under Test: Azure West Europe, Windows 365 Business Cloud PC, Windows 11, Xeon Platinum 8272CL 2.6GHz 2vCPUs, 8GB RAM, Microsoft Virtual Disk 128GB, no GPU.
Connection: RDP Shortpath, 15ms round trip time.
Connection: RDP Shortpath, 19ms round trip time.
Endpoint: NUC2, Intel NUC 8i7HNK with Windows 11, i7-8705G CPU @ 3.10GHz, 16GB RAM, 500GB Samsung SSD 850 EVO M.2, AMD Radeon RX Vega M GL, 4GB VRAM.
Endpoint: NUC2, Intel NUC 8i7HNK with Windows 11, i7-8705G CPU @ 3.10GHz, 16GB RAM, 500GB Samsung SSD 850 EVO M.2, AMD Radeon RX Vega M GL, 4GB VRAM.
Physical lab machine Lancelot versus Windows 365 Business Cloud PC
Test Engineer: Benny Tritsch
Date of test: 30 August 2022
Test Goal
This is a totally unfair and ridiculous comparison, but customers were asking for it: Are there workloads where the performance of the entry-level Windows 365 Business Cloud PC 2vGPU/8GB/128GB comes close to the reference host PC Lancelot?
Selected Sync Player Clips
| Simload and Link | View and Type | Observation | |
|---|---|---|---|
|
SL1-MSEdgeVideoConf6 | SxS View - STD | The Cloud PC session shows lower video performance, but significantly higher CPU consumption. |
|
SL1-ChromeAquariumWebGL | SxS View - STD | The Cloud PC session shows significantly lower graphics performance and frame rate. |
|
SL1-RollercoasterDX9 | SxS View - STD | The application doesn't switch to full-screen mode in the Cloud PC session and still shows lower frame rate. |
Summary of Test Observations
As was to be expected: The connection to the physical lab machine Lancelot outperforms the connection to the entry-level Windows 365 Business Cloud PC. But while Lancelot is a workstation-type of machine for knowledge workers or power user, the Cloud PC was designed for task workers or information workers. Using a Windows 365 instance with specs similar to Lancelot will change the result, but at a much higher Cloud PC price.
Test Setup Details
Lancelot
Windows 365 Cloud PC
System Under Test: Physical lab machine Lancelot, Windows 10, i7-11700K 3.6GHz, 8 cores (16 threads), 64GB RAM, Crucial MX500 SSD 1TB, no GPU.
System Under Test: Azure West Europe, Windows 365 Business Cloud PC, Windows 11, Xeon Platinum 8272CL 2.6GHz 2vCPUs, 8GB RAM, Microsoft Virtual Disk 128GB, no GPU.
Connection: RDP-UDP, 0ms round trip time.
Connection: RDP Shortpath, 19ms round trip time.
Endpoint: NUC2, Intel NUC 8i7HNK with Windows 11, i7-8705G CPU @ 3.10GHz, 16GB RAM, 500GB Samsung SSD 850 EVO M.2, AMD Radeon RX Vega M GL, 4GB VRAM.
Endpoint: NUC2, Intel NUC 8i7HNK with Windows 11, i7-8705G CPU @ 3.10GHz, 16GB RAM, 500GB Samsung SSD 850 EVO M.2, AMD Radeon RX Vega M GL, 4GB VRAM.
RDP-TCP versus RDP Shortpath (no GPU)
Test Engineer: Benny Tritsch
Date of test: 30 August 2022
Test Goal
Explore the difference between RDP-TCP and RDP-UDP (= RDP Shortpath) connections to an AVD D8ads v5 VM.
Selected Sync Player Clips
| Simload and Link | View and Type | Observation | |
|---|---|---|---|
|
SL1-ChromeGifScroll | SxS View - STD | User experience is similar, but RDP Shortpath (UDP) reduces CPU load and incoming network bandwidth (no handshake). |
|
SL1-RollercoasterDX9 | SxS View - STD | Network optimization after 10 seconds application runtime. RDP Shortpath (UDP) reduces incoming network bandwidth. |
Summary of Test Observations
While the user experience is similar on both sides, RDP Shortpath requires less network bandwidth.
Test Setup Details
RDP-TCP
RDP Shortpath
System Under Test: Azure West Europe, Azure Virtual Desktop VM type D8ads v5, AMD EPYC 7763 8vCPUs @ 2.4GHz, 32GB RAM, HDD 126GB, no GPU.
System Under Test: Azure West Europe, Azure Virtual Desktop VM type D8ads v5, AMD EPYC 7763 8vCPUs @ 2.4GHz, 32GB RAM, HDD 126GB, no GPU.
Connection: RDP-TCP, 23ms round trip time.
Connection: RDP Shortpath, 15ms round trip time.
Endpoint: NUC2, Intel NUC 8i7HNK with Windows 11, i7-8705G CPU @ 3.10GHz, 16GB RAM, 500GB Samsung SSD 850 EVO M.2, AMD Radeon RX Vega M GL, 4GB VRAM.
Endpoint: NUC2, Intel NUC 8i7HNK with Windows 11, i7-8705G CPU @ 3.10GHz, 16GB RAM, 500GB Samsung SSD 850 EVO M.2, AMD Radeon RX Vega M GL, 4GB VRAM.
RDP-TCP versus RDP Shortpath (M60 GPU)
Test Engineer: Benny Tritsch
Date of test: 30 August 2022
Test Goal
Explore the difference between RDP-TCP and RDP-UDP (= RDP Shortpath) connections to a GPU-accelerated AVD NV6 VM.
Selected Sync Player Clips
| Simload and Link | View and Type | Observation | |
|---|---|---|---|
|
SL1-MSEdgeCarVisualizer | SxS View - GPU | RDP-TCP network optimization every 10 seconds. RDP Shortpath (UDP) reduces CPU load and outgoing network bandwidth. |
|
SL1-MSEdgeVideoConf6 | SxS View - GPU | RDP Shortpath (UDP) reduces CPU load and network bandwidth, but increases GPU video decode/processing (video offloading). |
|
SL1-WMPlayer720pMP4 | SxS View - GPU | RDP Shortpath (UDP) reduces CPU load and network bandwidth significantly, but increases GPU video processing. |
|
SL1-DominoOpenGL | SxS View - GPU | RDP Shortpath (UDP) produces a slightly better user experience (frame rate). It also reduces CPU load and network bandwidth. |
|
SL1-FurMarkOpenGL | SxS View - GPU | RDP-TCP network optimization after 10 seconds application runtime. RDP Shortpath (UDP) produces a slightly better user experience (frame rate). It also reduces CPU load and network bandwidth. |
Summary of Test Observations
RDP Shortpath reduces CPU load and network bandwidth used by the GPU-accelerated Azure VM.
Test Setup Details
RDP-TCP
RDP Shortpath
System Under Test: Azure West Europe, Azure Virtual Desktop VM type NV6, Intel Xeon E5-2690 v3 6vCPUs @ 2.6GHz, 56GB RAM, Virtual HD ATA Device 340GB, NVIDIA M60 GPU (1/2 Card), 8GB VRAM.
System Under Test: Azure West Europe, Azure Virtual Desktop VM type NV6, Intel Xeon E5-2690 v3 6vCPUs @ 2.6GHz, 56GB RAM, Virtual HD ATA Device 340GB, NVIDIA M60 GPU (1/2 Card), 8GB VRAM.
Connection: RDP-TCP, 23ms round trip time.
Connection: RDP Shortpath, 15ms round trip time.
Endpoint: NUC2, Intel NUC 8i7HNK with Windows 11, i7-8705G CPU @ 3.10GHz, 16GB RAM, 500GB Samsung SSD 850 EVO M.2, AMD Radeon RX Vega M GL, 4GB VRAM.
Endpoint: NUC2, Intel NUC 8i7HNK with Windows 11, i7-8705G CPU @ 3.10GHz, 16GB RAM, 500GB Samsung SSD 850 EVO M.2, AMD Radeon RX Vega M GL, 4GB VRAM.
Lancelot without GPU versus AVD D8ads v5
Test Engineer: Benny Tritsch
Date of test: 30 August 2022
Test Goal
Compare an RDP connection to the physical lab machine Lancelot without GPU with an Azure Virtual Desktop D8ads v5 VM.
Selected Sync Player Clips
| Simload and Link | View and Type | Observation | |
|---|---|---|---|
|
SL1-ChromeAquariumWebGL | SxS View - Standard | Local RDP connection shows higher frame rate, but also higher network bandwidth. |
|
SL1-ChromeVideoGrid9 | SxS View - Standard | Almost similar user experience. Local RDP connection uses higher network bandwidth while AVD requires more CPU. |
|
SL1-WMPlayer720pMP4 | SxS View - Standard | Different resolutions when video runs with 100% size and both sides freeze when switching to full-screen. |
Summary of Test Observations
The overall performance of the physical lab machine Lancelot without GPU and the AVD D8ads v5 VM are quite similar. Only when compute resources are relevant, Lancelot outperforms the AVD session due to higher CPU thread (= core) number and higher clock rate.
Test Setup Details
Lancelot without GPU
AVD D8ads v5
System Under Test: Physical Lab Machine Lancelot, Windows 10, Intel i7-11700K 16Threads @ 3.6GHz, 64GB RAM, Crucial MX500 SSD 1TB, no GPU.
System Under Test: Azure West Europe, D8ads v5 VM, Windows 11 Enterprise, AMD EPYC 7763 8vCPUs @ 2.4GHz, 32GB RAM, HDD 126GB, no GPU.
Connection: RDP-UDP, 0ms round trip time.
Connection: RDP Shortpath, 15ms round trip time.
Endpoint: NUC2, Intel NUC 8i7HNK with Windows 11, i7-8705G CPU @ 3.10GHz, 16GB RAM, 500GB Samsung SSD 850 EVO M.2, AMD Radeon RX Vega M GL, 4GB VRAM.
Endpoint: NUC2, Intel NUC 8i7HNK with Windows 11, i7-8705G CPU @ 3.10GHz, 16GB RAM, 500GB Samsung SSD 850 EVO M.2, AMD Radeon RX Vega M GL, 4GB VRAM.
Lancelot with M5000 versus AVD NV4as v4 with 1/8 MI25
Test Engineer: Benny Tritsch
Date of test: 30 August 2022
Test Goal
Compare an RDP connection to the physical lab machine Lancelot (NVIDIA M5000 GPU) with an Azure Virtual Desktop NV4as v4 VM (1/8 of an AMD M25 GPU).
Selected Sync Player Clips
| Simload and Link | View and Type | Observation | |
|---|---|---|---|
|
SL1-DominoOpenGL | SxS View - GPU | The AVD NV4as v4 VM session with app start delay and visible issues, such as rapidly changing frame rates and focus problems. |
|
SL1-FurMarkOpenGL | SxS View - GPU | The AVD NV4as v4 VM session shows lower frame rates and micros studders due to limited GPU resources. |
|
SL1-MSEdgeWaterWebGL | SxS View - GPU | Even though the NV4as v4 VM AVD session uses more CPU and GPU resources, the OpenGL graphics quality is lower. |
Summary of Test Observations
The physical lab machine Lancelot with M5000 GPU massively outperforms the AVD NV4as v4 VM. 1/8 of an AMD Radeon MI25 is not sufficient in many use cases to keep up with the reference PC. The limitations of the MI25 graphics driver and the lack of compatibility with some video formats and OpenGL applications is another challenge.
Test Setup Details
Lancelot with M5000 GPU
AVD NV4as v4 with 1/8 MI25 GPU
System Under Test: Physical Lab Machine Lancelot, Windows 10, Intel i7-11700K 16Threads @ 3.6GHz, 64GB RAM, Crucial MX500 SSD 1TB, NVIDIA Quadro M5000, 8GB VRAM.
System Under Test: Azure North Europe, AVD NV4as v4 VM, Windows 10 Enterprise, AMD EPYC 7V12 (Rome) 4vCPUs @ 2.4GHz, 14GB RAM, HDD 126.45GB, 1/8 AMD Radeon MI25, 2GB VRAM.
Connection: RDP-UDP, 0ms round trip time.
Connection: RDP Shortpath, 28ms round trip time.
Endpoint: NUC2, Intel NUC 8i7HNK with Windows 11, i7-8705G CPU @ 3.10GHz, 16GB RAM, 500GB Samsung SSD 850 EVO M.2, AMD Radeon RX Vega M GL, 4GB VRAM.
Endpoint: NUC2, Intel NUC 8i7HNK with Windows 11, i7-8705G CPU @ 3.10GHz, 16GB RAM, 500GB Samsung SSD 850 EVO M.2, AMD Radeon RX Vega M GL, 4GB VRAM.
Lancelot with M5000 versus AVD NV6 with M60
Test Engineer: Benny Tritsch
Date of test: 30 August 2022
Test Goal
Compare an RDP connection to the physical lab machine Lancelot (NVIDIA M5000 GPU) with an Azure Virtual Desktop NV6 VM (NVIDIA M60 GPU).
Selected Sync Player Clips
| Simload and Link | View and Type | Observation | |
|---|---|---|---|
|
SL1-BSPBlendingDX11 | SxS View - GPU | Almost similar user experience. Higher CPU consumption in the AVD NV6 session, but higher network bandwidth required by local RDP connection. |
|
SL1-FurMarkOpenGL | SxS View - GPU | The AVD NV6 session shows slightly lower frame rates and micro stutters due to limited GPU resources. |
|
SL1-RollercoasterDX9.html | SxS View - GPU | The AVD NV6 session renders only half the frames on the host side, but user experience is almost similar. |
Summary of Test Observations
Very similar user experience on both sides, even with demanding use cases. The reason for this is that the M5000 and M60 graphics cards are using the same NVIDIA GM204 GPU chip with 2,048 shaders assigned to each machine. Only the CPU is more powerful on the Lancelot side.
Test Setup Details
Lancelot with M5000 GPU
AVD NV6 with M60 GPU
System Under Test: Physical Lab Machine Lancelot, Windows 10, Intel i7-11700K 16Threads @ 3.6GHz, 64GB RAM, Crucial MX500 SSD 1TB, NVIDIA Quadro M5000, 8GB VRAM.
System Under Test: Azure West Europe, AVD NV6 VM, Windows 10 Enterprise for Virtual Desktops, Intel Xeon E5-2690 v3 6vCPUs @ 2.6GHz, 56GB RAM, Virtual HD ATA Device 340GB, NVIDIA M60 GPU (1/2 Card), 8GB VRAM.
Connection: RDP-UDP, 0ms round trip time.
Connection: RDP Shortpath, 15ms round trip time.
Endpoint: NUC2, Intel NUC 8i7HNK with Windows 11, i7-8705G CPU @ 3.10GHz, 16GB RAM, 500GB Samsung SSD 850 EVO M.2, AMD Radeon RX Vega M GL, 4GB VRAM.
Endpoint: NUC2, Intel NUC 8i7HNK with Windows 11, i7-8705G CPU @ 3.10GHz, 16GB RAM, 500GB Samsung SSD 850 EVO M.2, AMD Radeon RX Vega M GL, 4GB VRAM.
AVD NCasT4 v3 with NVIDIA Tesla T4 GPU
Test Engineer: Benny Tritsch
Date of test: 30 August 2022
Test Goal
Measure the performance of the NVIDIA T4-powered AVD NCasT4 v3 VM when running a very demanding OpenGL application.
Selected Sync Player Clips
| Simload and Link | View and Type | Observation | |
|---|---|---|---|
|
SL1-FurMarkOpenGL | Single View - GPU | Very high frame rate on the host side and on the client side, resulting in outstanding performance and great user experience. |
Summary of Test Observations
The AVD NCasT4 v3 VM delivers outstanding performance. Unfortunately, at the time of testing, this VM type lacks availability in many Azure regions and is not officially certified for popular CAD/CAM programs.
Test Setup Details
- System Under Test: Azure West Europe, NCasT4 v3 VM, Windows 10 Pro, AMD EPYC 7V12 64-Core Processor 2.4Ghz 8vCPUs, 28GB RAM, HDD 126GB, NVIDIA Tesla T4, 16GB VRAM.
- Connection: RDP Shortpath, 15ms round trip time.
- Endpoint: NUC2, Intel NUC 8i7HNK with Windows 11, i7-8705G CPU @ 3.10GHz, 16GB RAM, 500GB Samsung SSD 850 EVO M.2, AMD Radeon RX Vega M GL, 4GB VRAM.
Incompatible Use Cases: AVD D8ads v5 without GPU
Test Engineer: Benny Tritsch
Date of test: 30 August 2022
Test Goal
Find out what can go wrong when running demanding graphics workloads in an AVD D8ads v5 VM without GPU.
Selected Sync Player Clips
| Simload and Link | View and Type | Observation | |
|---|---|---|---|
|
SL1-CinebenchOpenGL | Single View - Standard | Error: OpenGL application launches, but then terminates without error message due to missing GPU. |
|
SL1-FurMarkOpenGL | Single View - Standard | Error: OpenGL application doesn't launch without error message due to missing GPU. |
|
SL1-WMPlayer720pMP4 | Single View - Standard | Error: 720p MP4 video freezes when user sets it to full-screen. |
Summary of Test Observations
These are clearly the wrong use cases for an Azure VM without GPU, typically unnoticed by host-side monitoring systems. Many IT administrators don't know about these effects, that's why screen videos are so important...
Test Setup Details
- System Under Test: Azure West Europe, D8ads v5 VM, Windows 11 Enterprise, AMD EPYC 7763 8vCPUs @ 2.4GHz, 32GB RAM, HDD 126GB, no GPU.
- Connection: RDP-TCP, 23ms round trip time.
- Endpoint: NUC2, Intel NUC 8i7HNK with Windows 11, i7-8705G CPU @ 3.10GHz, 16GB RAM, 500GB Samsung SSD 850 EVO M.2, AMD Radeon RX Vega M GL, 4GB VRAM.