[Overview of Results Collected During EUC Score Test Runs]
Windows Optimizers [2026]
 Benny Tritsch
 Markus Zehnle
There are several tools for optimizing virtual Windows desktops. But what are the reasons for optimization, specifically for Azure Virtual Desktop environments?
Performance & Responsiveness: Shared resources require a lean operating system, fewer background services and scheduled tasks, faster logons and application launches, and a consitent and predictable desktop experience.
Scalability & Cost Efficiency: Higher user density, reduced CPU, RAM and disk I/O consumption, and lower infrastructure and cloud costs.
Stability, Security & Operations: Fewer variables in multi-user environments, reduced attack surface and easier compliance, vendor recommended configuration, easier image maintenance and lifecycle management
Test Goal
Compare an Out-of-the-Box AVD VM with the same VM type optimized using Citrix Optimizer, Omnissa OSOT or Microsoft VDOT.
The Out-of-the-Box (OOB) system is a D8ads v7 VM configured as part of an Azure Virtual Desktop host pool, Windows 11 Enterprise multi-session, AMD EPYC 9V45 8vCPUs @ 2.60GHz, 32GB RAM, 128GB NVME Premium SSD, 1920x1080 Screen Resolution @ 30Hz, Single Monitor Setup, hosted in the Azure West Europe datacenter in the Netherlands. The optimized VMs use the same golden image before running the respective optimizer.
Selected Citrix Optimizer Clips
The Citrix Optimizer Tool v3.5.0.13 is a free PowerShell-based Windows tool, featuring a GUI, designed to help administrators optimize operating systems (specifically VDA images) for better performance. It analyzes systems against templates, removes unnecessary services/tasks, and reduces resource usage to improve VDI/SBC environments. Citrix Optimizer download link.
| Simload Thumbnails | Links | Comparisons | Links [Charts] | Views | Observations |
|---|---|---|
|
OOB vs Citrix Optimizer
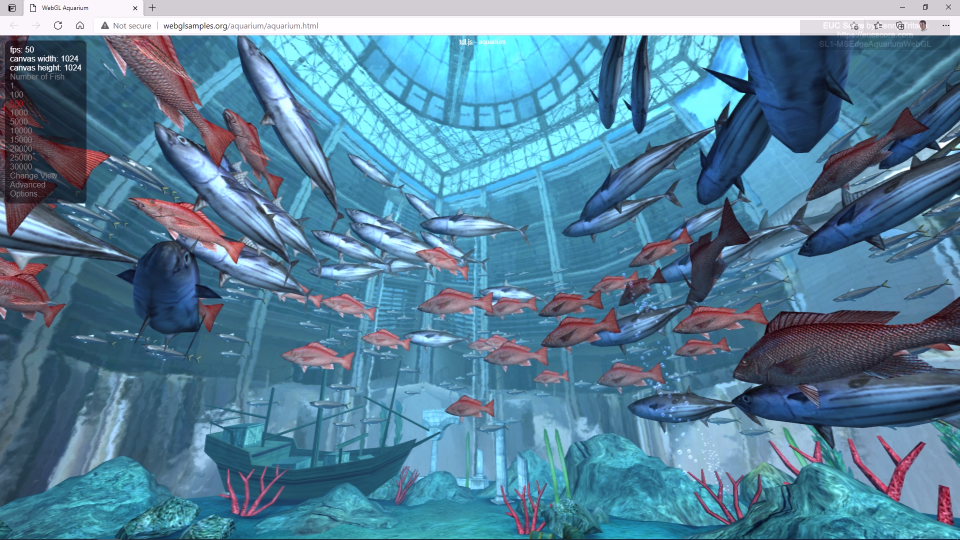
SL1-MSEdgeAquariumWebGL [STD12] Side-by-Side View |
No difference in the visual output quality. But working set and number of processes are lower in the optimized system, but bandwidth requirements are higher in the Citrix Optimizer session (red). |
|
OOB vs Citrix Optimizer
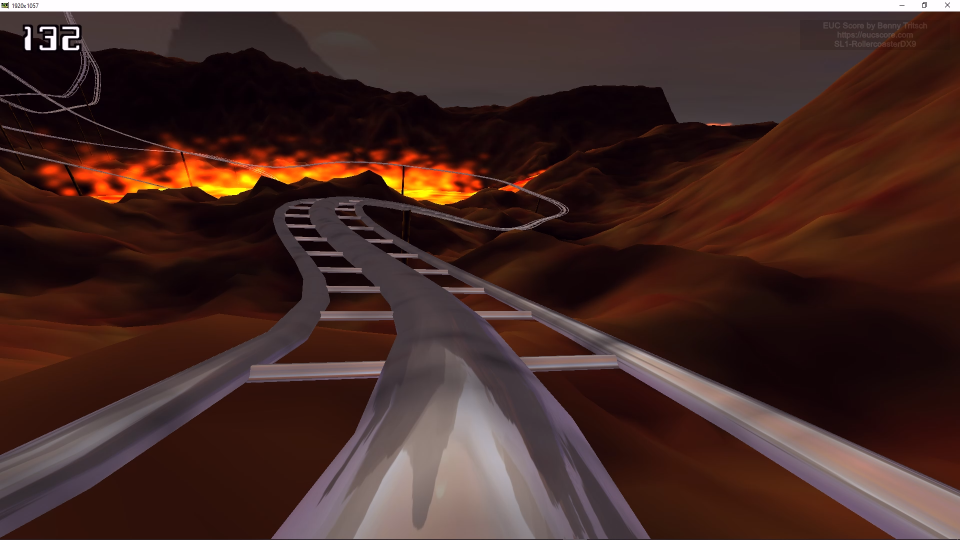
SL1-RollercoasterDX9 [STD12] Side-by-Side View |
No difference in the visual output quality. But context switches, working set, number of processes and all disk performance values are lower in the Citrix Optimizer session (red). |
|
OOB vs Citrix Optimizer
SL1-WMPlayer1080pMP4 [STD12] Side-by-Side View |
No difference in the visual output quality. But CPU load, context switches, working set, number of processes and all disk performance values are lower in the Citrix Optimizer session (red). |
Selected Omnissa Horizon Windows OSOT Clips
The Omnissa Horizon Windows OS Optimization Tool (OSOT) v3.5.0.13 is a customization tool designed to enhance Virtual Desktop Infrastructure (VDI) performance by disabling unnecessary Windows services, features, and registry keys. It streamlines golden image creation, reducing resource usage (CPU/RAM) and improving login times for Windows 10/11 and Server 2019/2022. Omnissa OSOT download link.
| Simload Thumbnails | Links | Comparisons | Links [Charts] | Views | Observations |
|---|---|---|
|
|
OOB vs OSOT
SL1-MSEdgeAquariumWebGL [STD12] Side-by-Side View |
No difference in the visual output quality. But working set and number of processes are lower in the OSOT optimized system (red). |
|
|
OOB vs OSOT
SL1-RollercoasterDX9 [STD12] Side-by-Side View |
No difference in the visual output quality. But context switches, working set, number of processes and all disk performance values are lower in the OSOT optimized session (red). |
|
|
OOB vs OSOT
SL1-WMPlayer1080pMP4 [STD12] Side-by-Side View |
No difference in the visual output quality. But CPU load, context switches, working set, number of processes and all disk performance values are lower in the OSOT optimized session (red). |
Selected Microsoft VDOT Clips
The Virtual Desktop Optimization Tool 2026-04-04 (VDOT) (previously Windows Desktop Optimization Tool - WDOT) is a free PowerShell-based script from Microsoft that boosts performance for Windows 10/11 and Azure Virtual Desktop (AVD) environments. It optimizes session hosts by disabling unnecessary services, scheduled tasks, and apps to improve login times and increase user density. Microsoft VDOT download link.
| Simload Thumbnails | Links | Comparisons | Links [Charts] | Views | Observations |
|---|---|---|
|
|
OOB vs VDOT
SL1-MSEdgeAquariumWebGL [STD12] Side-by-Side View |
No difference in the visual output quality and almost identical performance counter values. |
|
|
OOB vs VDOT
SL1-RollercoasterDX9 [STD12] Side-by-Side View |
No difference in the visual output quality. But context switches, working set, number of processes and all disk performance values are lower in the VDOT optimized session (red). |
|
|
OOB vs VDOT
SL1-WMPlayer1080pMP4 [STD12] Side-by-Side View |
VDOT removed several Windows tools: WMPlayer is not available in the VDOT optimized session (red). |
Summary of Test Observations
Both Citrix Optimizer and Omnissa OSOT show an improved working set and reduced number of processes, but the same perceived user experience as the OOB system. Microsoft VDOT shows a very aggressive removal of some system tools, slightly improved system metrics, but the same perceived user experience as the OOB system.
With optimizers on single-user VMs, no changes or only minimal changes can be observed in the perceived user experience. However, the optimized systems have more free resources that can benefit demanding applications: fewer background services and scheduled tasks, resulting in reduced CPU, RAM, disk I/O consumption, and process numbers.
Test Setup Details
Azure Virtual Desktop (OOB)
Azure Virtual Desktop (Optimized)
System Under Test: Azure West Europe Netherlands, Azure Virtual Desktop, D8ads v7 VM, Windows 11 Enterprise multi-session, AMD EPYC 9V45 8vCPUs @ 2.60GHz, 32GB RAM, 128GB NVME Premium SSD, 1920x1080 Screen Resolution @ 30Hz, Single Monitor Setup. Out-of-Box configuration.
System Under Test: Azure West Europe Netherlands, Azure Virtual Desktop, D8ads v7 VM, Windows 11 Enterprise multi-session, AMD EPYC 9V45 8vCPUs @ 2.60GHz, 32GB RAM, 128GB NVME Premium SSD, 1920x1080 Screen Resolution @ 30Hz, Single Monitor Setup. Citrix Optimizer, Omnissa OSOT or Microsoft VDOT.
Connection: SxS RDP, 100mbps bandwidth, 15ms RTT, 0.0% packet loss.
Connection: SxS RDP, 100mbps bandwidth, 15ms RTT, 0.0% packet loss.
Endpoint: ASUS NUC 15 PRO, Windows 11, Intel Core Ultra 7 255H 16Cores @ 2.0GHz, 32GB RAM, Samsung SSD 990 EVO Plus 1TB, Intel Arc 140T GPU, 2GB VRAM, Windows App 2.0.
Endpoint: ASUS NUC 15 PRO, Windows 11, Intel Core Ultra 7 255H 16Cores @ 2.0GHz, 32GB RAM, Samsung SSD 990 EVO Plus 1TB, Intel Arc 140T GPU, 2GB VRAM, Windows App 2.0.