[Overview of Results Collected During EUC Score Test Runs]
Dizzion Frame Remoting Protocol [2025]
Analyzing Dizzion Frame Desktop as a Service and Cloud PC performance on Azure. Compared remoting protocols are Frame Remoting Protocol (FRP), Microsoft Remote Desktop Protocol (RDP) and Citrix HDX.
The various network conditions are simulated using a physical WAN emulator located in the network connection between the endpoint device and the internet router. The latency (round trip time - RTT) between the test lab and the Azure data center in Frankfurt, Germany, is 10 ms.
The test results presented here are a subset of the complete data sets collected during multiple test sequences.
- Impact of Different Network Conditions on the FRP Protocol
- Comparison between Dizzion FRP and Microsoft RDP 11 (classic)
- Comparison between Dizzion FRP and Citrix HDX
If you want to learn how the EUC Score results were produced then check out EUC Score Test Methodology and EUC Score Toolset.
Impact of Different Network Conditions on the FRP Protocol
 Benny Tritsch
 Ruben Spruijt
Test Goal
Measure the impact of network packet loss (0%, 2%, 5%), network round trip time (10ms, 110ms, 310ms), and network bandwidth (100mbps, 8mbps, 2mbps) on the Dizzion FRP protocol. The comparison clips show unconstrained network conditions as a baseline on the left (yellow) and constrained network conditions on the right (red).
Selected Sync Player Clips
| Simload Thumbnails | Links | Network | Links [Charts] | Views | Observations |
|---|---|---|
|
Packet Loss: 0.0% vs 2.0%
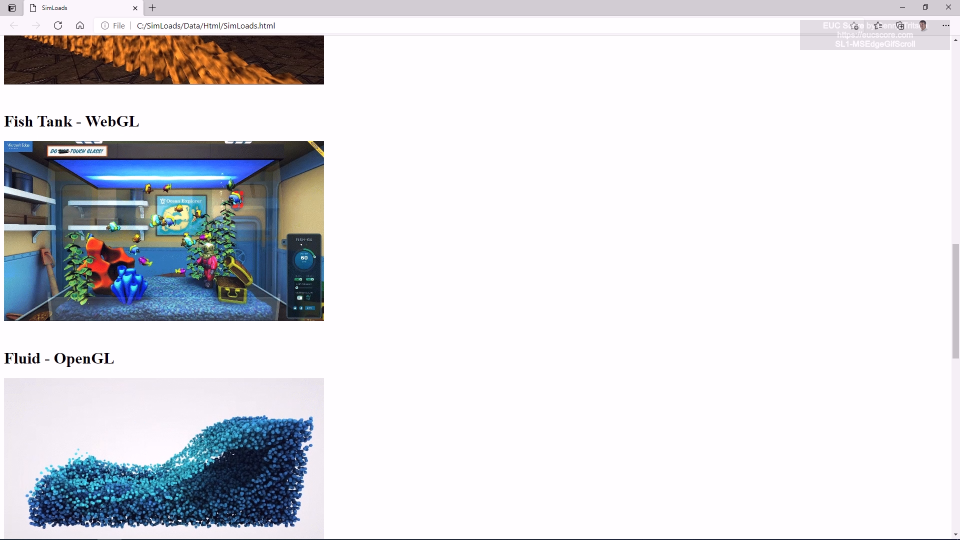
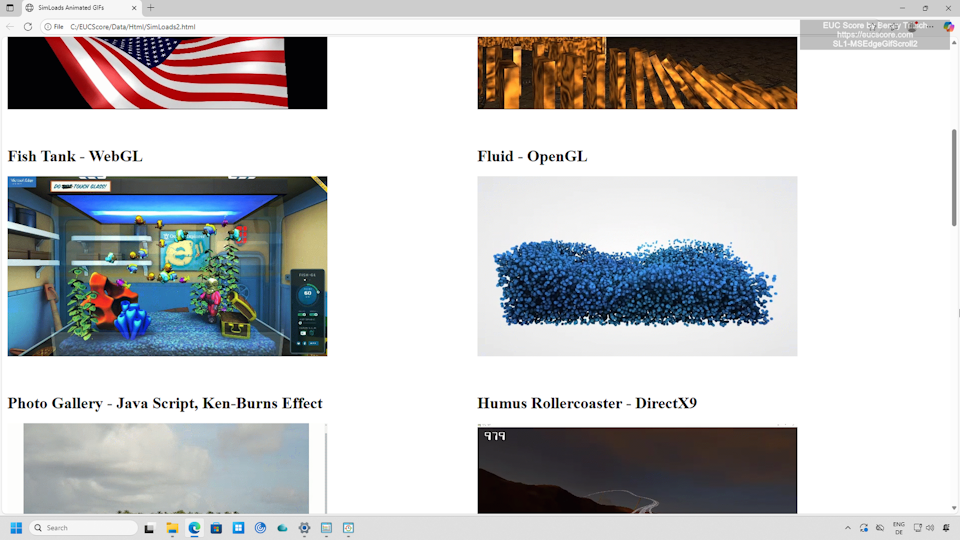
SL1-MSEdgeAquariumWebGL [STD12] SL1-MSEdgeAquariumWebGL [FRP12] Side-by-Side View |
High packet loss rate causes sporadic stuttering. |
|
|
Packet Loss: 0.0% vs 5.0%
SL1-MSEdgeAquariumWebGL [STD12] SL1-MSEdgeAquariumWebGL [FRP12] Side-by-Side View |
Very high packet loss rate causes more stuttering. |
|
Packet Loss: 0.0% vs 5.0%
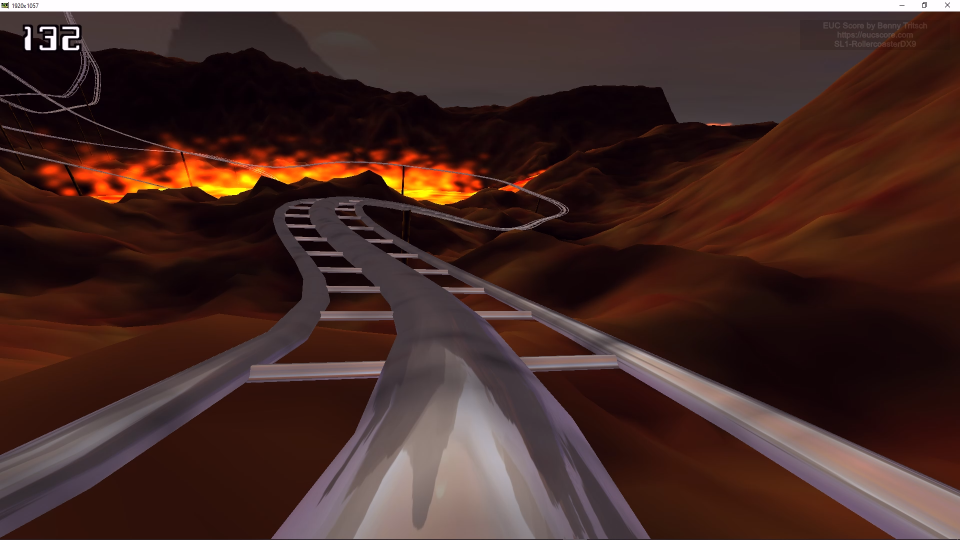
SL1-RollercoasterDX9 [STD12] SL1-RollercoasterDX9 [FRP12] Side-by-Side View |
Very high packet loss rate causes significant stuttering. |
|
Packet Loss: 0.0% vs 5.0%
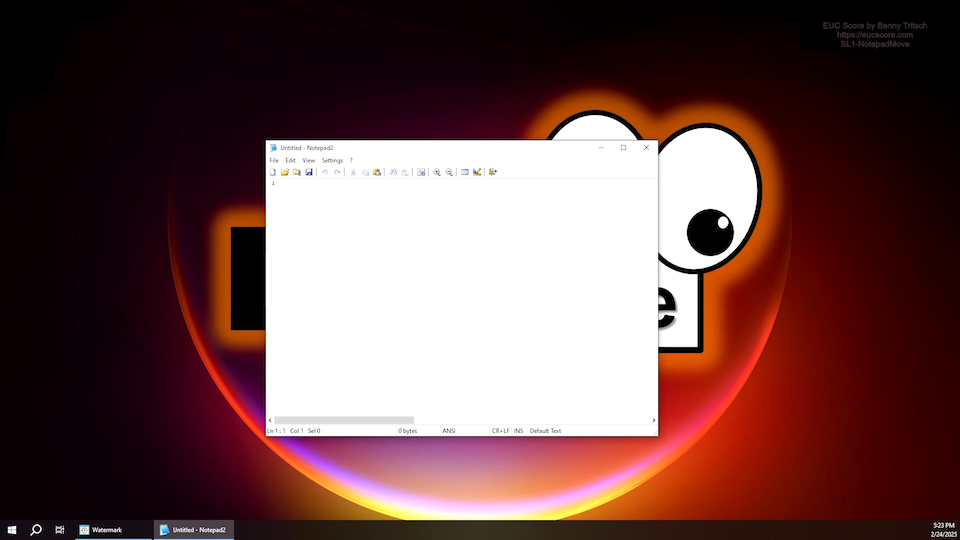
SL1-NotepadMove [STD12] SL1-NotepadMove [FRP12] Side-by-Side View |
Very high packet loss rate causes significant stuttering. |
|
Round Trip Time: 10ms vs 110ms
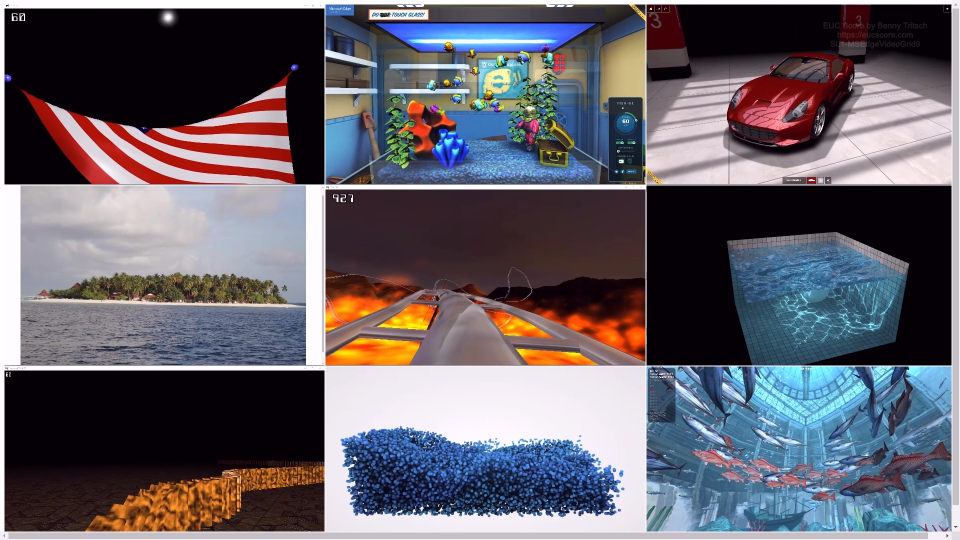
SL1-MSEdgeVideoGrid9 [STD12] SL1-MSEdgeVideoGrid9 [FRP12] Side-by-Side View |
High RTT does not change image quality and frame rate. |
|
|
Round Trip Time: 10ms vs 310ms
SL1-MSEdgeVideoGrid9 [STD12] SL1-MSEdgeVideoGrid9 [FRP12] Side-by-Side View |
Very high RTT does not change image quality and frame rate. |
|
|
Bandwidth: 100mbps vs 8mbps
SL1-RollercoasterDX9 [STD12] SL1-RollercoasterDX9 [FRP12] Side-by-Side View |
Low bandwidth introduces compression artifacts. |
|
|
Bandwidth: 100mbps vs 2mbps
SL1-MSEdgeVideoGrid9 [STD12] SL1-MSEdgeVideoGrid9 [FRP12] Side-by-Side View |
Very low bandwidth affects image quality and frame rate. |
Summary of Test Observations
Adding network constraints influences the visual quality of Dizzion Cloud PC sessions connected via FRP. A higher amount of Packet loss introduces stuttering in animations and videos. Adding a higher amount of network latency doesn't have an impact on graphics quality, but due to the higher user interface response times it's much harder for a user to interact with the desktop and the apps. Reducing the network bandwidth results in compression artifacts and reduced frame rates in many test workloads.
Test Setup Details
Dizzion Cloud PC Baseline (Unconstrained)
Dizzion Cloud PC Comparison
System Under Test: Dizzion Cloud PC, Azure Germany West Central, Windows 11 Enterprise, Intel Xeon Platinum 8370C 8vCPUs @ 2.80GHz, 32GB RAM, 128GB HDD (SAS), Frame Server 9.4.5.0, Frame Guest Agent 2.4.2.0, 1920x1080 Screen Resolution @ 30Hz, Single Monitor Setup.
System Under Test: Dizzion Cloud PC, Azure Germany West Central, Windows 11 Enterprise, Intel Xeon Platinum 8370C 8vCPUs @ 2.80GHz, 32GB RAM, 128GB HDD (SAS), Frame Server 9.4.5.0, Frame Guest Agent 2.4.2.0, 1920x1080 Screen Resolution @ 30Hz, Single Monitor Setup.
Connection: Dizzion FRP, 100mbps bandwidth, 10ms RTT, 0.0% packet loss.
Connection: Dizzion FRP, different network conditions: 2% and 5% packet loss, 110ms and 310ms RTT, 8mbps and 2mbps bandwidth.
Endpoint: ASUS NUC 15 PRO, Windows 11, Intel Core Ultra 7 255H 16Cores @ 2.0GHz, 32GB RAM, Samsung SSD 990 EVO Plus 1TB, Intel Arc 140T GPU, 2GB VRAM, Google Chrome 140.0.7339.81.
Endpoint: ASUS NUC 15 PRO, Windows 11, Intel Core Ultra 7 255H 16Cores @ 2.0GHz, 32GB RAM, Samsung SSD 990 EVO Plus 1TB, Intel Arc 140T GPU, 2GB VRAM, Google Chrome 140.0.7339.81.
Comparison between Dizzion FRP and Microsoft RDP 11 (Classic)
Test Goal
Compare a Dizzion Cloud PC and a Microsoft Remote Desktop (Classic RDP) under different network conditions.
Selected Sync Player Clips
| Simload Thumbnails | Links | Network | Links [Charts] | Views | Observations |
|---|---|---|
|
Unconstrained: FRP vs Classic RDP
SL1-MSEdgeGifScroll1 [STD12] Side-by-Side View |
No visual difference, but FRP requires less bandwidth. |

|
Unconstrained: FRP vs Classic RDP
SL1-MSEdgeHtmlScroll [STD12] Side-by-Side View |
Smoother scrolling with FRP, but higher bandwidth required. |
|
|
Unconstrained: FRP vs Classic RDP
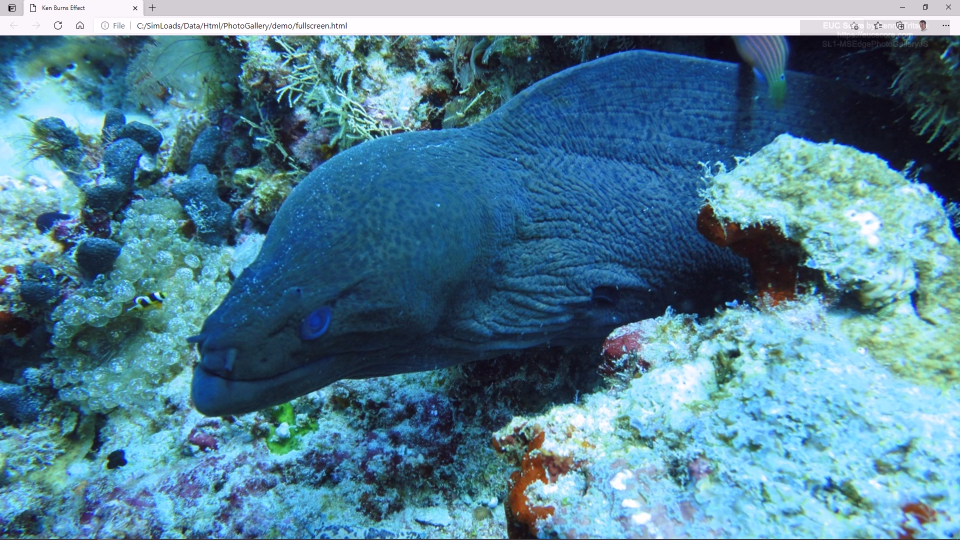
SL1-MSEdgePhotoGalleryJS [STD12] Side-by-Side View |
Smoother animation with FRP, but higher bandwidth required. |
|
|
2% Packet Loss: FRP vs Classic RDP
SL1-NotepadMove [STD12] Side-by-Side View |
The app window moves smoother in the FRP session. |
|
|
5% Packet Loss: FRP vs Classic RDP
SL1-NotepadMove [STD12] Side-by-Side View |
Freeze frames with RDP, only some stuttering with FRP. |
|
|
5% Packet Loss: FRP vs Classic RDP
SL1-MSEdgePhotoGalleryJS [STD12] Side-by-Side View |
Freeze frames with RDP, only some stuttering with FRP. |
|
|
5% Packet Loss: FRP vs Classic RDP
SL1-RollercoasterDX9 [STD12] Side-by-Side View |
Freeze frames with RDP, only some stuttering with FRP. |
|
110ms RTT: FRP vs Classic RDP
SL1-MSEdgeGifScroll2 [STD12] Side-by-Side View |
Smooth animated GIFs with FRP, but stuttering with RDP. |
|
|
310ms RTT: FRP vs Classic RDP
SL1-RollercoasterDX9 [STD12] Side-by-Side View |
No visual difference under very high latency conditions, but FRP requires more bandwidth. |
|
|
310ms RTT: FRP vs Classic RDP
SL1-MSEdgePhotoGalleryJS [STD12] Side-by-Side View |
No visual difference under very high latency conditions, but FRP requires more bandwidth. |
|
|
8mbps Bandwidth: FRP vs Classic RDP
SL1-MSEdgeVideoGrid9 [STD12] Side-by-Side View |
Lower video quality and reduced frame rates with RDP. |
|
|
2mbps Bandwidth: FRP vs Classic RDP
SL1-MSEdgePhotoGalleryJS [STD12] Side-by-Side View |
Better image quality with FRP. |
|
|
2mbps Bandwidth: FRP vs Classic RDP
SL1-RollercoasterDX9 [STD12] Side-by-Side View |
More compression artifacts with RDP. |
Summary of Test Observations
Without network constraints, many workloads don't show a big visual difference between FRP and Classic RDP. In some cases, RDP requires less bandwidth than FRP, but there are exceptions. In some workloads, FRP shows better image and animation quality. FRP is better able to handle packet loss. Even with increasing latency, FRP shows good performance, but often requires more bandwidth. Low network bandwidth also poses no problems for FRP. Compared to RDP, FRP generally offers better image quality under low bandwidth conditions. Across almost all workloads and regardless of network conditions, the FRP session requires more CPU capacity than the RDP session.
Test Setup Details
Dizzion Cloud PC
Microsoft Remote Desktop
System Under Test: Dizzion Cloud PC, Azure Germany West Central, Windows 11 Enterprise, Intel Xeon Platinum 8370C 8vCPUs @ 2.80GHz, 32GB RAM, 128GB HDD (SAS), Frame Server 9.4.5.0, Frame Guest Agent 2.4.2.0, 1920x1080 Screen Resolution @ 30Hz, Single Monitor Setup.
System Under Test: Dizzion Cloud PC, Azure Germany West Central, Windows 11 Enterprise, Intel Xeon Platinum 8370C 8vCPUs @ 2.80GHz, 32GB RAM, 128GB HDD (SAS), 1920x1080 Screen Resolution @ 30Hz, Single Monitor Setup.
Connection: Dizzion FRP, different network conditions.
Connection: Microsoft Classic RDP (RDP11), different network conditions.
Endpoint: ASUS NUC 15 PRO, Windows 11, Intel Core Ultra 7 255H 16Cores @ 2.0GHz, 32GB RAM, Samsung SSD 990 EVO Plus 1TB, Intel Arc 140T GPU, 2GB VRAM, Google Chrome 140.0.7339.81.
Endpoint: ASUS NUC 15 PRO, Windows 11, Intel Core Ultra 7 255H 16Cores @ 2.0GHz, 32GB RAM, Samsung SSD 990 EVO Plus 1TB, Intel Arc 140T GPU, 2GB VRAM, RDC 10.0.26.100.
Comparison between Dizzion FRP and Citrix HDX
Test Goal
Compare a Dizzion Cloud PC and a Citrix Cloud PC (Windows 365) under different network conditions.
Important: The test results for Citrix for Windows 365 presented here are underwhelming. The reason is that the out-of-the-box settings of the HDX version used during the test runs gives higher refresh rates a higher priority than better image quality. Further reference tests using newer versions of the HDX protocol will be conducted in the future to verify the results.
Selected Sync Player Clips
| Simload Thumbnails | Links | Network | Links [Charts] | Views | Observations |
|---|---|---|

|
Unconstrained: FRP vs HDX
SL1-MSEdgeVideoConf4 [STD12] Side-by-Side View |
No visual difference, but FRP requires less bandwidth. |
|
|
2% Packet Loss: FRP vs HDX
SL1-NotepadMove [STD12] Side-by-Side View |
Smooth animation on both sides, FRP requires more bandwidth. |
|
|
5% Packet Loss: FRP vs HDX
SL1-RollercoasterDX9 [STD12] Side-by-Side View |
HDX session shows block artifacts, FRP requires more bandwidth. |
|
|
110ms RTT: FRP vs HDX
SL1-MSEdgeGifScroll2 [STD12] Side-by-Side View |
Smooth animated GIFs on both sides, FRP requires more bandwidth. In contrast, the CPU requirement is higher in the HDX session. |
|
|
310ms RTT: FRP vs HDX
SL1-RollercoasterDX9 [STD12] Side-by-Side View |
No visual difference, but FRP requires more bandwidth. |
|
|
310ms RTT: FRP vs HDX
SL1-MSEdgePhotoGalleryJS [STD12] Side-by-Side View |
Animation in HDX session is struggling. |
|
|
8mbps Bandwidth: FRP vs HDX
SL1-MSEdgeVideoGrid9 [STD12] Side-by-Side View |
Lower video quality with HDX. |

|
2mbps Bandwidth: FRP vs HDX
SL1-MSEdgeFishbowlHTML5 [STD12] Side-by-Side View |
Better animation quality with FRP. |
|
|
2mbps Bandwidth: FRP vs HDX
SL1-MSEdgeFishbowlHTML5 [STD12] Side-by-Side View |
Better image and transition quality with FRP. |
|
|
2mbps Bandwidth: FRP vs HDX
SL1-RollercoasterDX9 [STD12] Side-by-Side View |
More compression artifacts with HDX. |
Summary of Test Observations
Without network constraints, most workloads don't show a visual difference between FRP and HDX. In most cases, HDX requires less bandwidth than FRP, but there are exceptions. Under limited network conditions, most FRP test runs also show better image and animation quality, but higher bandwidth requirements. With few exceptions, there is no significant difference in CPU capacity requirements when workloads run in either an FRP or an HDX session.
Test Setup Details
Dizzion Cloud PC
Citrix for Windows 365
System Under Test: Dizzion Cloud PC, Azure Germany West Central, Windows 11 Enterprise, Intel Xeon Platinum 8370C 8vCPUs @ 2.80GHz, 32GB RAM, 128GB HDD (SAS), Frame Server 9.4.5.0, Frame Guest Agent 2.4.2.0, 1920x1080 Screen Resolution @ 30Hz, Single Monitor Setup.
System Under Test: Citrix for Windows 365, Azure Germany West Central, Windows 11 Enterprise, Intel Xeon Platinum 8370C 8vCPUs @ 2.80GHz, 32GB RAM, 128GB HDD, Citrix VDA 2402.0 CU1, 1920x1080 Screen Resolution @ 30Hz, Single Monitor Setup.
Connection: Dizzion FRP, different network conditions.
Connection: Citrix HDX, different network conditions.
Endpoint: ASUS NUC 15 PRO, Windows 11, Intel Core Ultra 7 255H 16Cores @ 2.0GHz, 32GB RAM, Samsung SSD 990 EVO Plus 1TB, Intel Arc 140T GPU, 2GB VRAM, Google Chrome 140.0.7339.81.
Endpoint: ASUS NUC 15 PRO, Windows 11, Intel Core Ultra 7 255H 16Cores @ 2.0GHz, 32GB RAM, Samsung SSD 990 EVO Plus 1TB, Intel Arc 140T GPU, 2GB VRAM, Citrix Workspace App 2503.