[Overview of Results Collected During EUC Score Test Runs]
Windows 365 Enterprise GPU Super [2024]
 Test Engineer: Benny Tritsch
Date of test: 14-15 October 2024
Test Engineer: Benny Tritsch
Date of test: 14-15 October 2024
Test Goal
Show the performance impact that different network conditions have on Windows 365 Enterprise GPU Super VMs. The reference on the left (yellow) side is always 100mbps bandwidth, 10ms latency, 0% packet loss. On the right (red) side, option [1] limits the bandwidth to 8mbps, option [2] adds 100ms latency (110ms in total), and option [3] adds 2% packet loss.
Selected Sync Player Clips
| Simload Thumbnails | Simloads | Links | Observations |
|---|---|---|
|
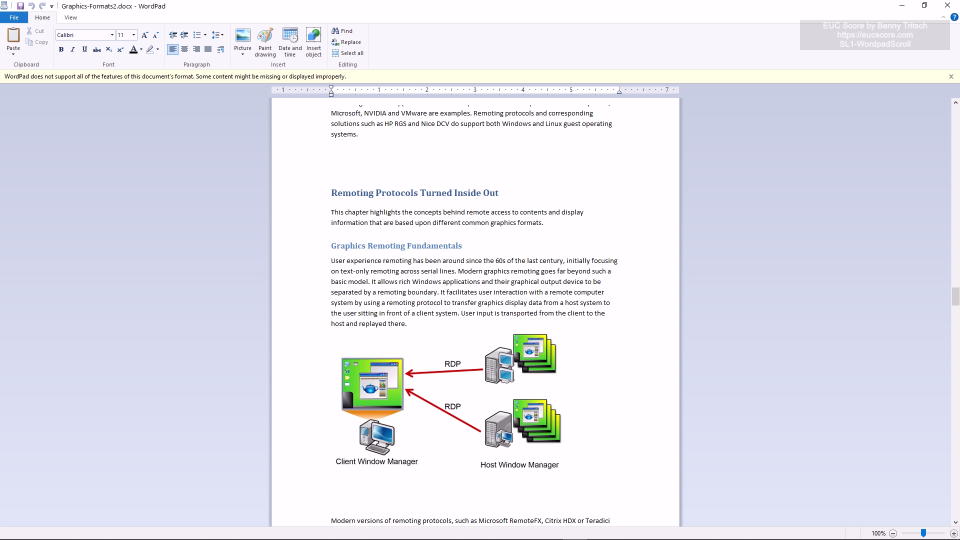
SL1-WordpadScroll [1] 100mbps vs 8mbps [2] 10ms vs 110ms [3] 0% vs 2% Loss |
Noticeable performance impact when packet loss rate is 2%. |
|
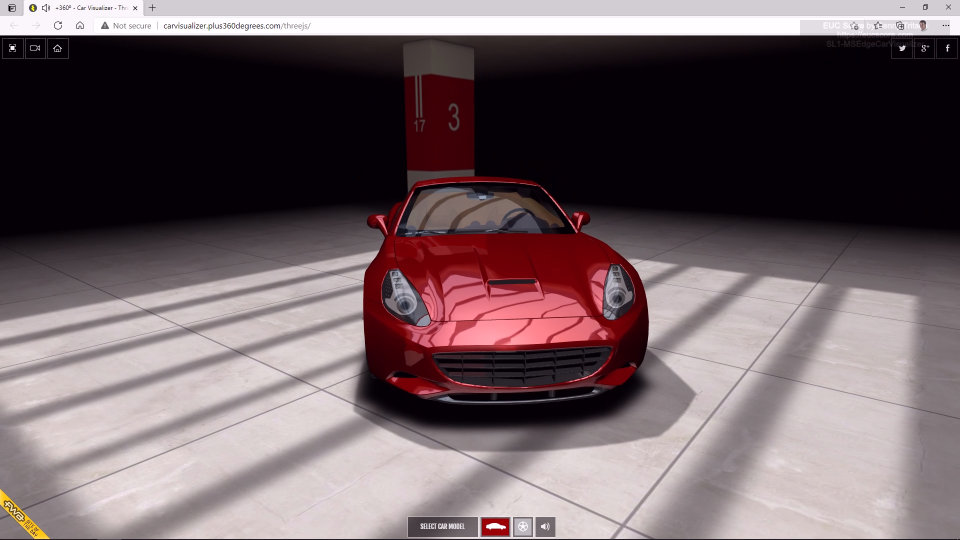
SL1-MSEdgeCarVisualizer [1] 100mbps vs 8mbps [2] 10ms vs 110ms [3] 0% vs 2% Loss |
The output shows significant stuttering when the packet loss rate is 2%. |
|
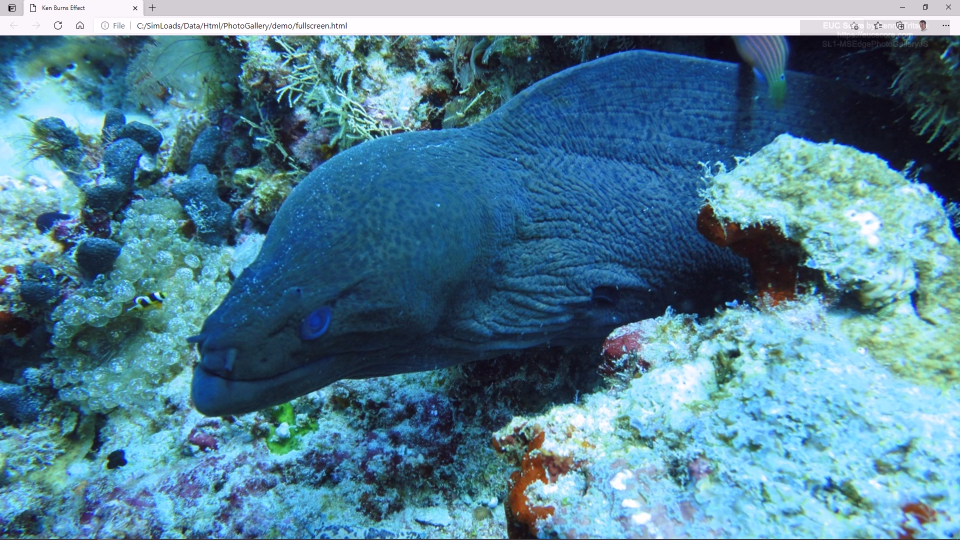
SL1-MSEdgePhotoGalleryJS [1] 100mbps vs 8mbps [2] 10ms vs 110ms [3] 0% vs 2% Loss |
All network limitations have a negative impact on performance, especially the 2% packet loss rate. |
|
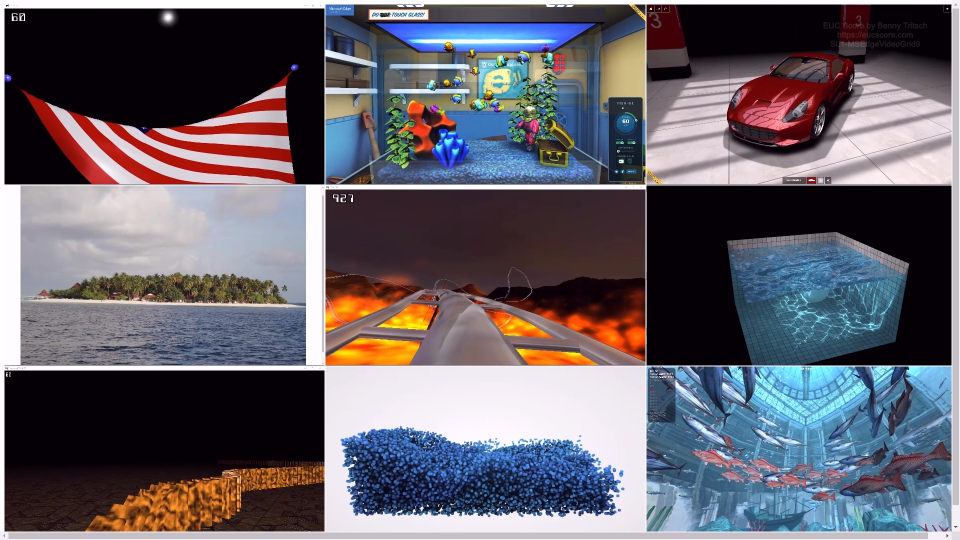
SL1-MSEdgeVideoGrid9
[1] 100mbps vs 8mbps [2] 10ms vs 110ms [3] 0% vs 2% Loss |
All network limitations have a more or less negative impact on performance, especially the 2% packet loss rate. |
|
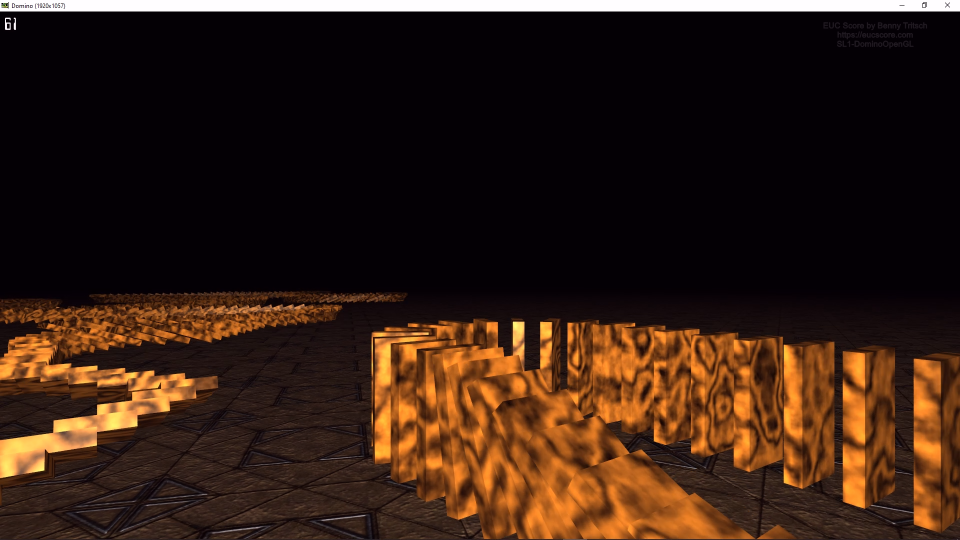
SL1-DominoOpenGL [1] 100mbps vs 8mbps [2] 10ms vs 110ms [3] 0% vs 2% Loss |
Graphics performance is outstanding, only a packet loss rate of 2% shows significant stuttering. |
|
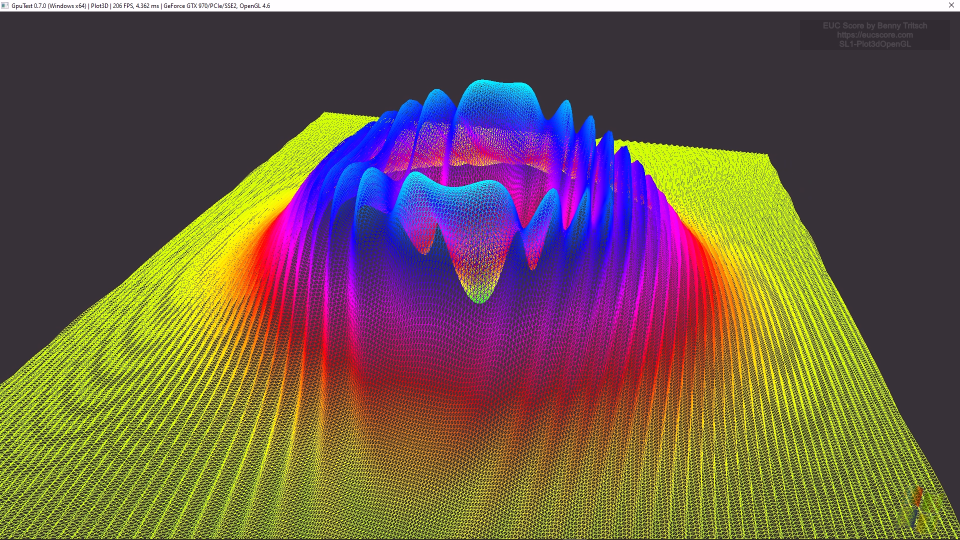
SL1-Plot3dOpenGL [1] 100mbps vs 8mbps [2] 10ms vs 110ms [3] 0% vs 2% Loss |
All network limitations have a negative impact on the performance of this very demanding graphics Simload. |

|
SL1-TessMarkOpenGL [1] 100mbps vs 8mbps [2] 10ms vs 110ms [3] 0% vs 2% Loss |
All network limitations have a more or less negative impact on performance. |
Summary of Test Observations
The Windows 365 Enterprise GPU Super VM shows outstanding performance and user experience under good network conditions. Network restrictions change the picture especially for graphics intensive Simloads. The greatest negative impact on performance can be observed at a packet loss rate of 2%.
Test Setup Details
Windows 365 GPU Super Baseline
Windows 365 GPU Super with Network Limits
System Under Test: Azure Germany West Central, Windows 365 Enterprise GPU Super, AVC444 High Image Quality, Windows 11, AMD EPYC 74F3 18vCPUs @ 3.2GHz, 220GB RAM, 1000GB Microsoft Virtual Disk, NVIDIA A10-12Q GPU, Remote Desktop Services SxS Network Stack.
System Under Test: Azure Germany West Central, Windows 365 Enterprise GPU Super, AVC444 High Image Quality, Windows 11, AMD EPYC 74F3 18vCPUs @ 3.2GHz, 220GB RAM, 1000GB Microsoft Virtual Disk, NVIDIA A10-12Q GPU, Remote Desktop Services SxS Network Stack.
Connection: SxS RDP-UDP, 100mbps bandwidth, 10ms latency, 0% packet loss.
Connection: SxS RDP-UDP. [1] 8mbps bandwidth limit, [2] additional 100ms latency, [3] 2% packet loss.
Endpoint: NUC2, Intel NUC 8i7HNK with Windows 11, i7-8705G CPU @ 3.10GHz, 16GB RAM, 500GB Samsung SSD 850 EVO M.2, AMD Radeon RX Vega M GL, 4GB VRAM, Windows App 1.3.272.0.
Endpoint: NUC2, Intel NUC 8i7HNK with Windows 11, i7-8705G CPU @ 3.10GHz, 16GB RAM, 500GB Samsung SSD 850 EVO M.2, AMD Radeon RX Vega M GL, 4GB VRAM, Windows App 1.3.272.0.