[Overview of Results Collected During EUC Score Test Runs]
Windows 365: Microsoft RDP versus Citrix HDX [2024]
 Benny Tritsch
 Simon Binder
Test Goal
Compare Windows remote desktop connections established via the Microsoft RDP and Citrix HDX protocols. The System Under Test (SUT) is a Windows 365 Enterprise VM with 2 vCPUs and 8GB of memory, hosted on Azure West Europe. This "minimal" or entry-level Windows 365 VM size is very popular among customers or individual users who are trying out Windows 365 Cloud PC for the first time.
Selected Sync Player Clips
| Simload Thumbnails | Links | Links | Views | Charts | Observations |
|---|---|---|
|
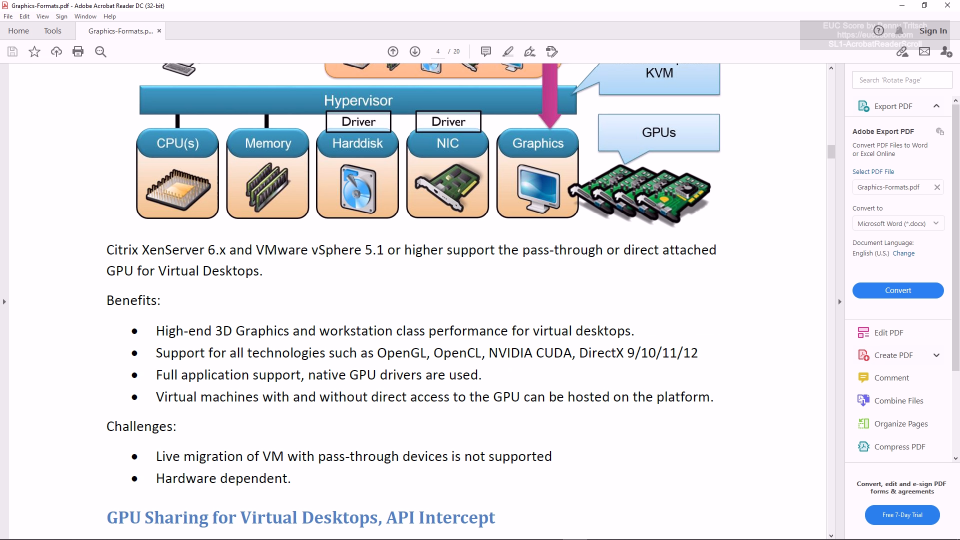
SL1-AcrobatReaderScroll Side-by-Side View STD Telemetry |
Almost similar user experience and performance metrics. That's not a big surprise as the GDI calls created by Adobe Acrobat Reader don't require many resources and the user-initiated screen refreshs are triggered once per second only. |
|
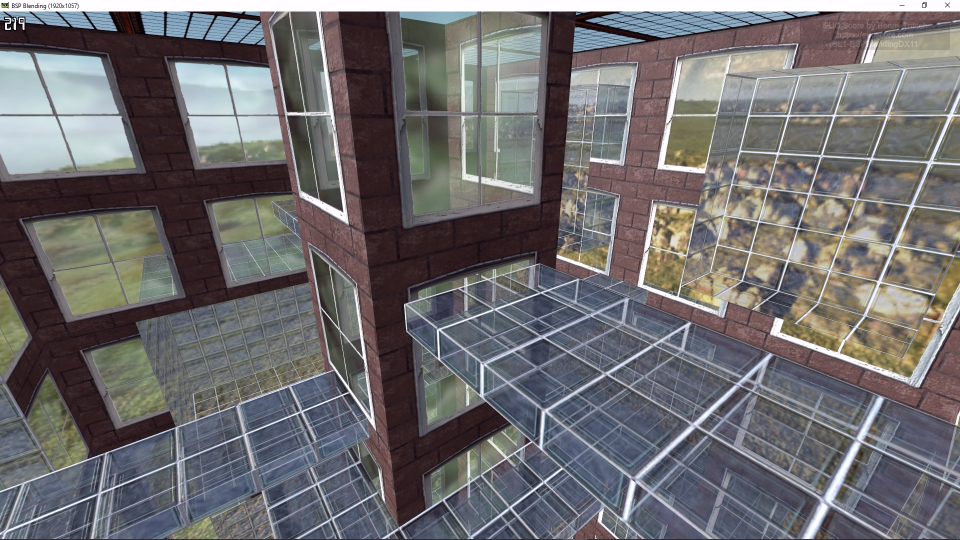
SL1-BSPBlendingDX11 Side-by-Side View STD Telemetry |
This DirectX 11 application is very demanding. As a result, the CPU goes to 100% right from the beginning. The user tries to maneuver in the 3D scene every second, but the system cannot keep up, neither on the RDP nor on the HDX side. |
|
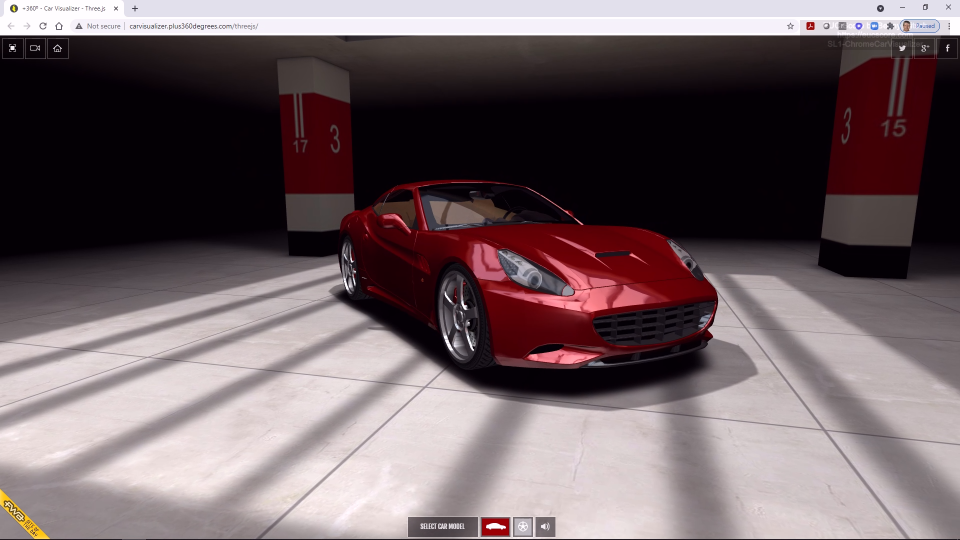
SL1-ChromeCarVisualizer Side-by-Side View STD Telemetry |
The Car Visualizer WebGL animation is very demanding. The system performance is represented by the rotation speed of the car - which is similarly slow on both sides, despite the good image quality. No remoting protocol can compensate the lack of CPU resources. |
|
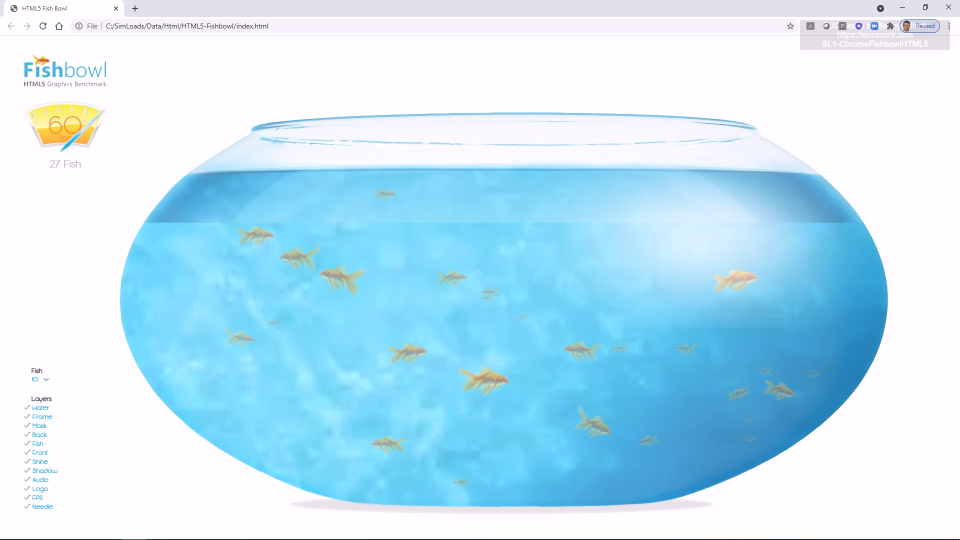
SL1-ChromeFishbowlHTML5 Side-by-Side View STD Telemetry |
On this VM type, the Fishbowl HTML5 app running in the Chrome browser brings the CPU to 100%. The user presses the + button to create a new fish every half second. This works well on the right HDX side (color-coded in red), but it doesn't work on the left RDP side (yellow). |
|
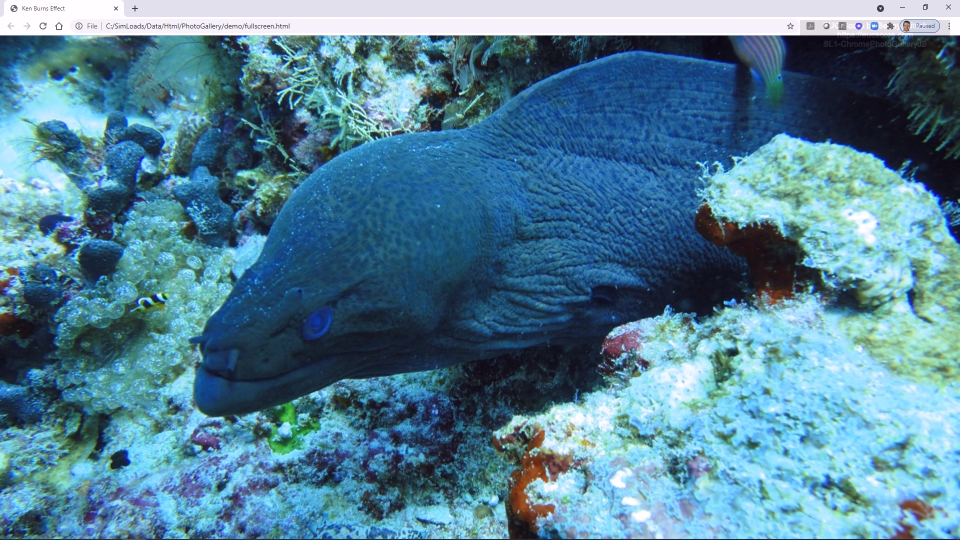
SL1-ChromePhotoGalleryJS Side-by-Side View STD Telemetry |
The Photo Gallery Simload is based on the resource-intensive Ken-Burns algorithm, showing image zoom, rotation and transition effects implemented in JavaScript. The HDX side shows better usage of the CPU resources and smoother photo transitions compared to the RDP side, with only small differences regarding network consumption. |
|
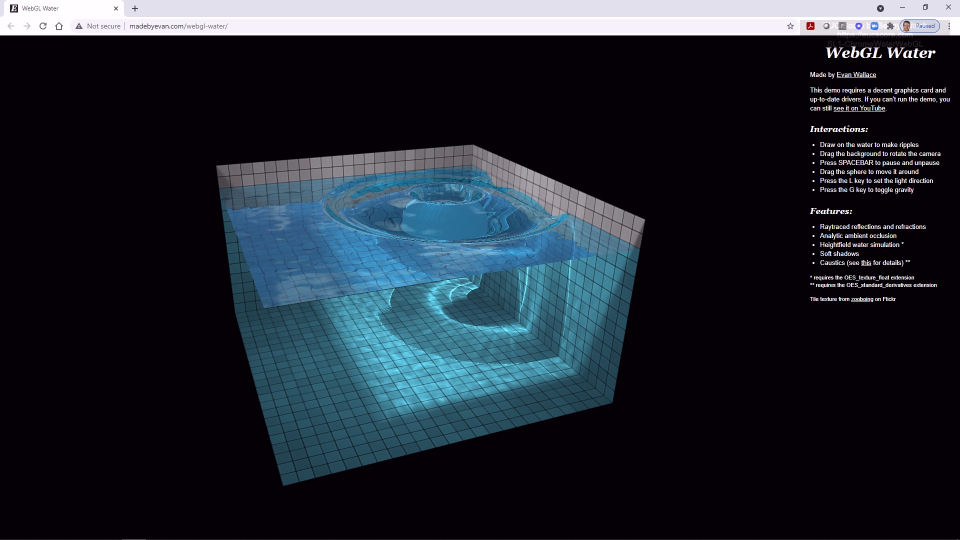
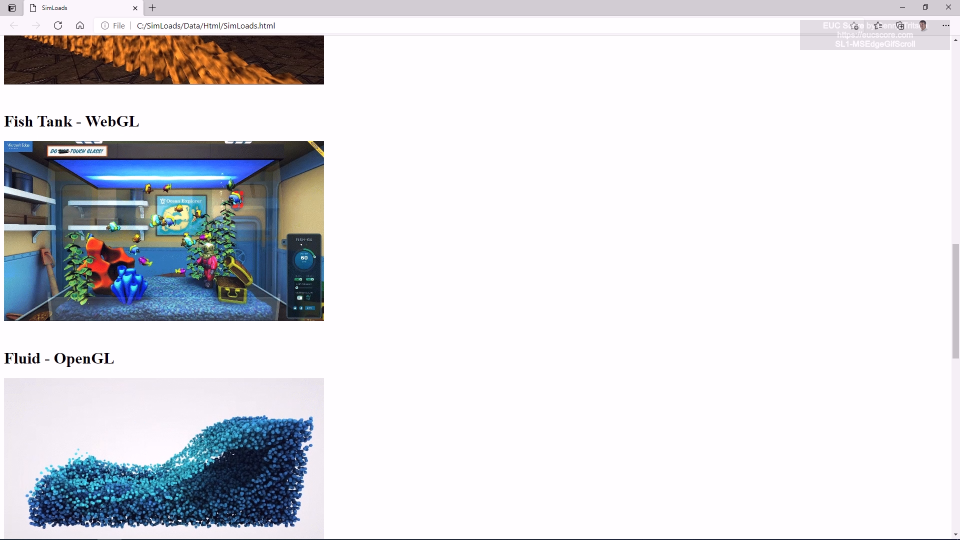
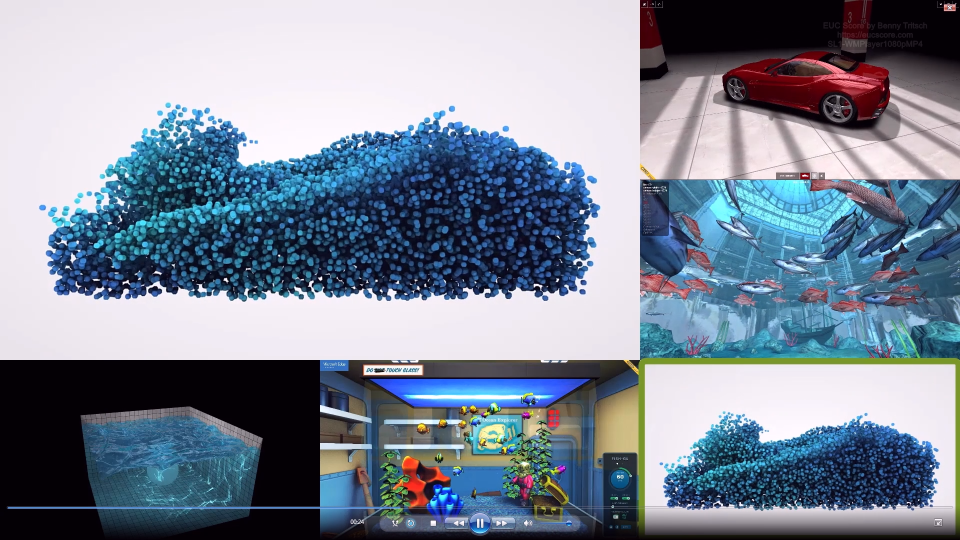
SL1-ChromeWaterWebGL Side-by-Side View STD Telemetry |
The Water WebGL Simload running in the Chrome browser brings the CPU of this VM type constantly to 100%. There is no visible difference between the RDP and the HDX sessions. Slightly higher network consumption by HDX, most probably due to the higher frame rate. |
|
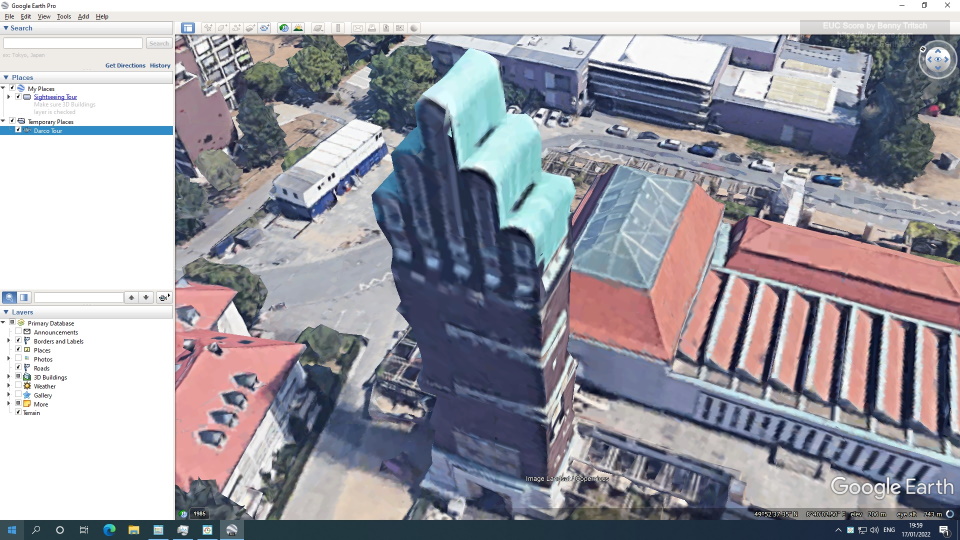
SL1-GoogleEarthDX Side-by-Side View STD Telemetry |
The Google Earth DirectX 9 Simload brings the CPU of this VM type constantly to 100%. For both RDP and HDX, this leads to a very low refresh rate of the animation and massively delayed response times in the Open dialog box. |
|
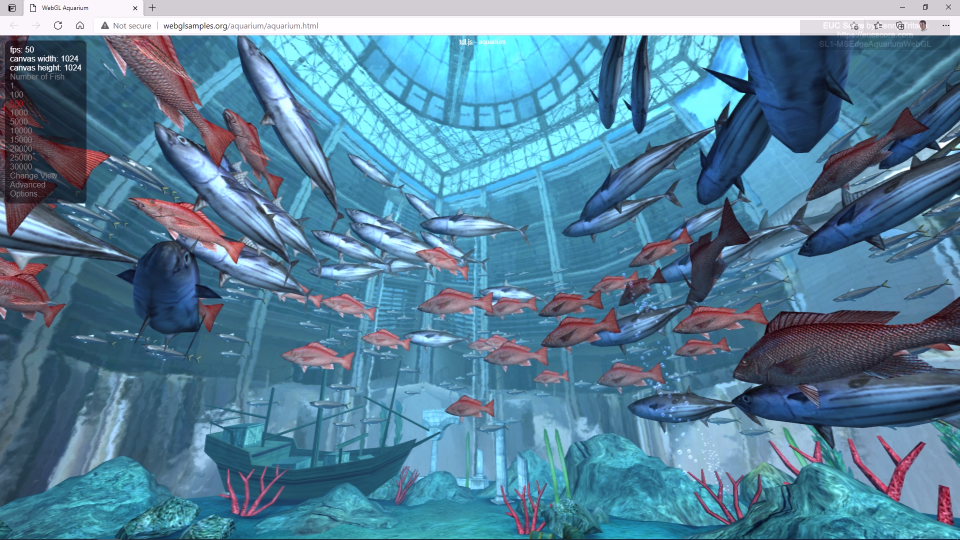
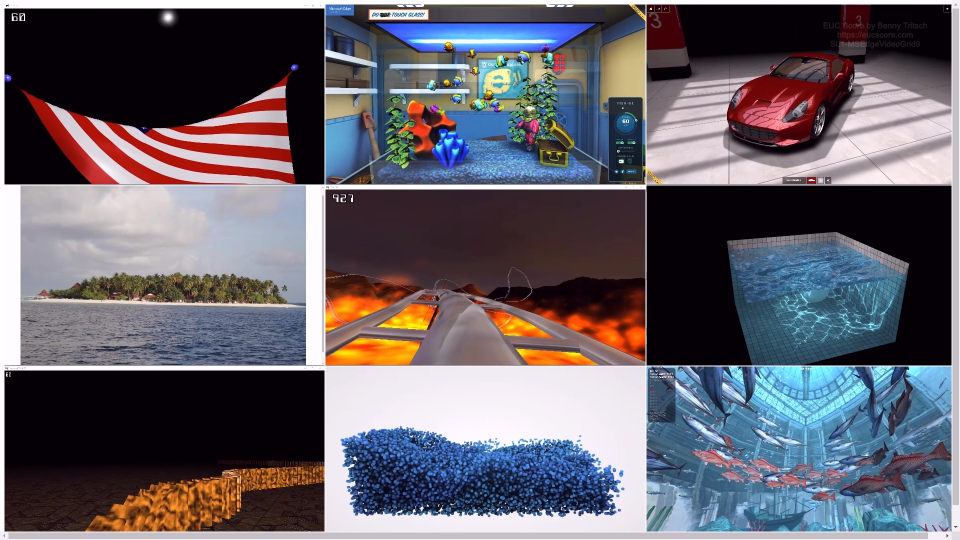
SL1-MSEdgeAquariumWebGL Side-by-Side View STD Telemetry |
The WebGL animation of an aquarium with 500 fish shows an unusal behavior on the left RDP side, with a view from the outside of the aquarium sphere. The right HDX side shows the correct animation, but with a lower frame rate. |

|
SL1-MSEdgeFishbowlHTML5 Side-by-Side View STD Telemetry |
The Fishbowl HTML5 app running in the Microsoft Edge browser brings the CPU of this VM type constantly to 100%. The RDP session on the left produces a much higher CPU queue length and struggles with the user interaction. It fails to create new fish while this is working much better in the right HDX side. |
|
SL1-MSEdgeGifScroll1 Side-by-Side View STD Telemetry |
When opening an HTML page with animated GIFs in the Microsoft Edge browser, the left RDP session opens some GIFs with a delay. Scrolling the page up and down works equally well on both sides. |

|
SL1-MSEdgeVideoConf6 Side-by-Side View STD Telemetry |
Running six MP4 videos simultaneously in the Microsoft Edge browser show a similar good quality for both RDP and HDX, bringing the CPU to 100%. There is a notable difference in the user session-specific CPU load, but this doesn't influence the system-wide CPU consumption. |
|
SL1-MSEdgeVideoGrid Side-by-Side View STD Telemetry |
When running nine MP4 videos simultaneously in the Microsoft Edge browser, the HDX session show a better user experience. There are more studders and a higher network consumption on the RDP side. |
|
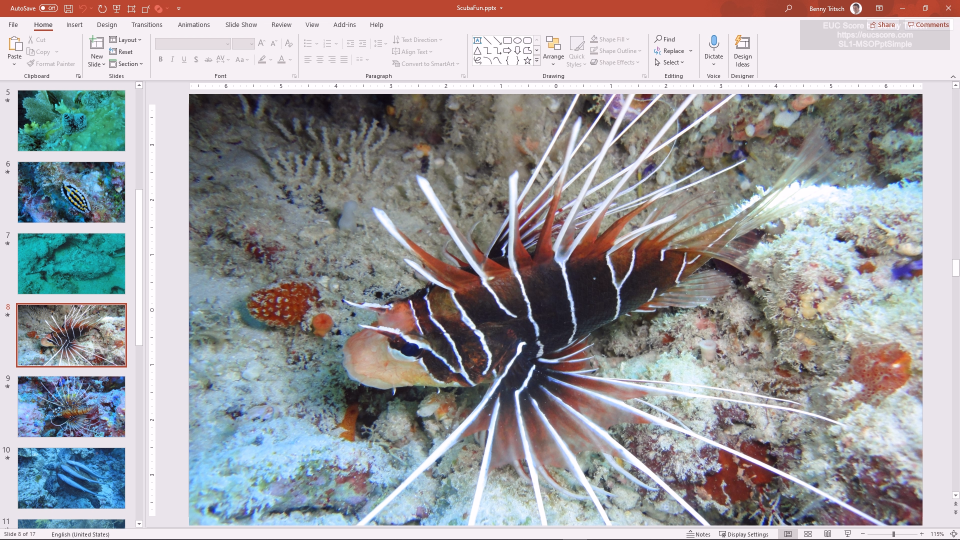
SL1-MSOPptSimple Side-by-Side View STD Telemetry |
This entry-level Windows 365 VM type is well suited for Office workloads such as the PowerPoint Simple Simload, independently of the remoting protocol. The only (technical) benefit that the HDX session brings to the table is the higher frame rate. |
|
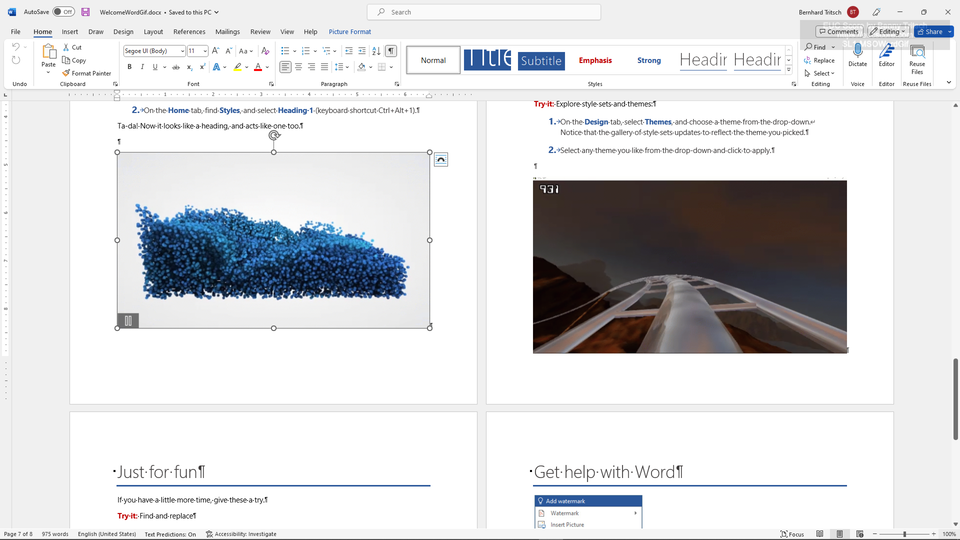
SL1-MSOWordGif Side-by-Side View STD Telemetry |
This entry-level Windows 365 VM type is well suited for Office workloads such as the Simload showing a Word document with GIF images, independently of the remoting protocol. The only (technical) benefit that the HDX session brings to the table is the higher frame rate. |
|
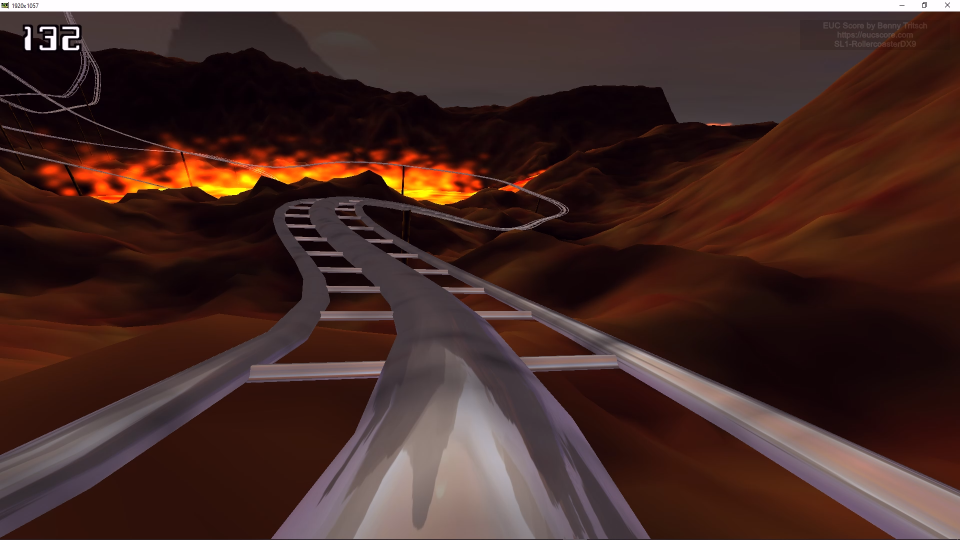
SL1-RollercoasterDX9 Side-by-Side View STD Telemetry |
Only eight or nine frames per second of the Rollercoaster DirectX 9 animation are rendered in the frame buffer due to CPU limitations. The output on the client side is studdering and shows less than 1fps, independently of the remoting protocol. It's notable that RDP requires significantly less bandwidth and CPU after 25 seconds. |
|
SL1-WMPlayer1080pMP4 Side-by-Side View STD Telemetry |
Running a 1080p MP4 video in the Windows Media Player fails completely on the left RDP side and show unacceptable smearing effects on the right HDX side. |

|
SL1-WMPlayer720pMP4 Side-by-Side View STD Telemetry |
When running a 720p MP4 video in the Windows Media Player, everything looks equally good on both sides as long as the video player is in windowed mode. But when switching to full-screen mode, the video freezes on the RDP side. And there is a much lower CPU demand on the HDX side. |
|
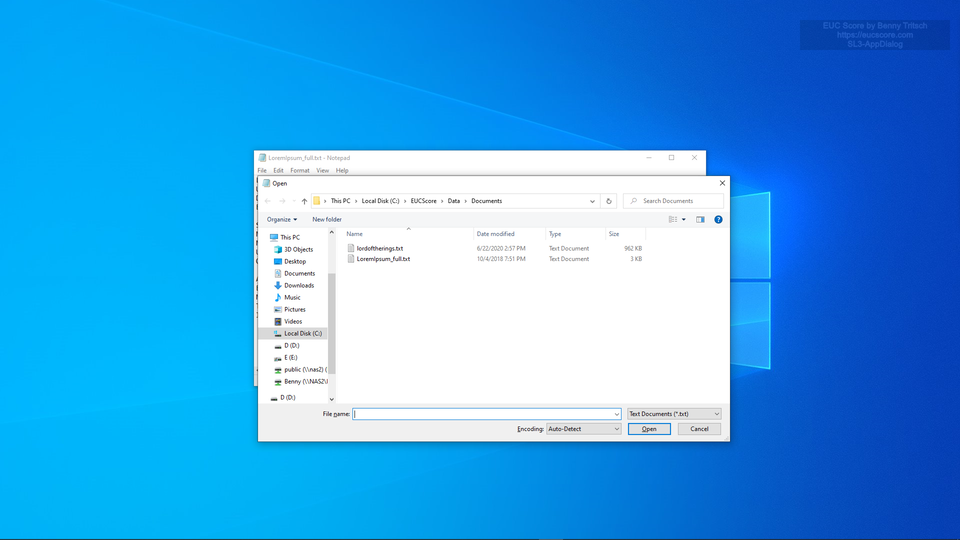
SL3-AppDialog Side-by-Side View STD Telemetry |
App Dialog score: 0.36 on the RDP side, 0.32 on the HDX side (lower is better). Only small differences when measuring the time is takes to open a dialog window. |
|
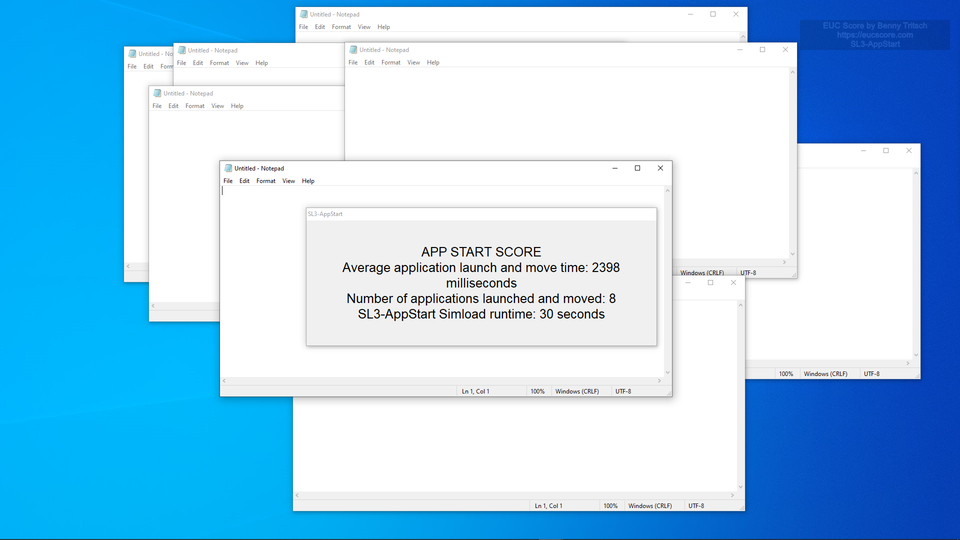
SL3-AppStart Side-by-Side View STD Telemetry |
The RDP session shows an almost 20% better score when starting an application. App Start score: 0.78 on the RDP side, 0.93 on the HDX side (lower is better). |
|
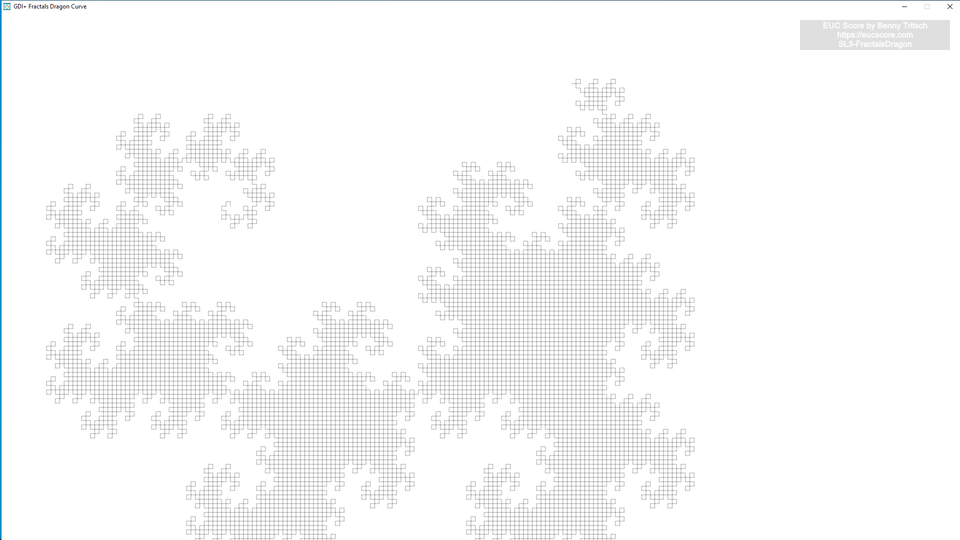
SL3-FractalsDragon Side-by-Side View STD Telemetry |
RDP beats HDX when comparing their GDI+ Dragon scores. GDI+ Fractals Dragon Curve score: 2.64 on the RDP side, 2.91 on the HDX side (lower is better). |
|
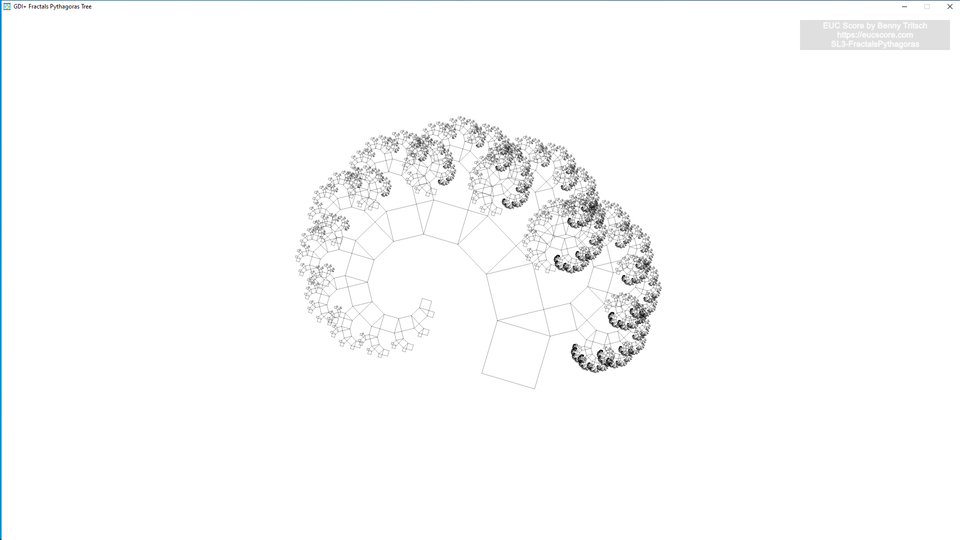
SL3-FractalsPythagoras Side-by-Side View STD Telemetry |
RDP beats HDX when comparing their GDI+ Pythagoras scores. GDI+ Fractals Pythagoras Tree score: 4.4 on the RDP side, 4.89 on the HDX side (lower is better). |

|
SL3-GDIPlusRect Side-by-Side View STD Telemetry |
RDP beats HDX when comparing their GDI+ Rectangles scores. GDI+ Rectangles score: 2.04 on the RDP side, 2.71 on the HDX side (lower is better). But the screen output is studdering significantly more on the RDP side. |
|
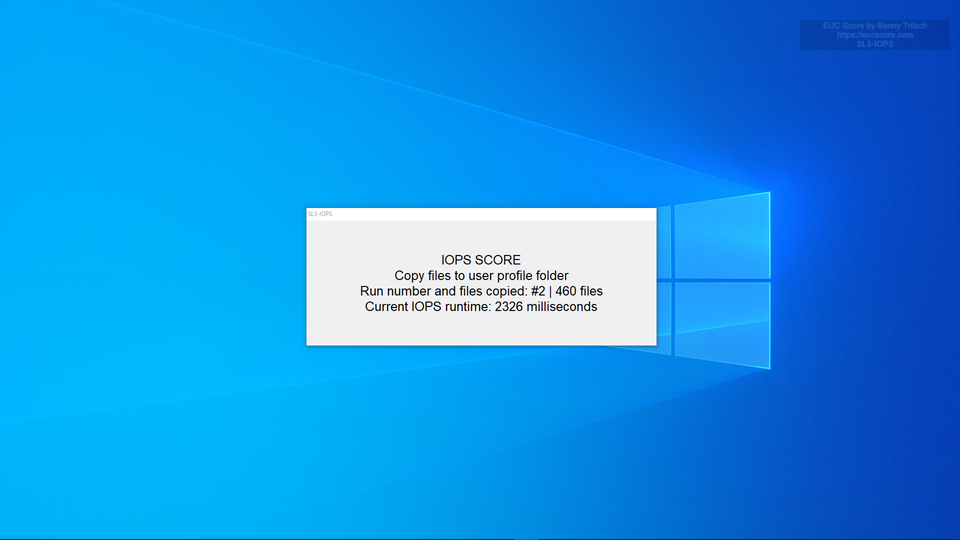
SL3-IOPS Side-by-Side View STD Telemetry |
Surprisingly, RDP beats HDX by approx. 5% when comparing their IOPS scores - even though it's the identical underlying storage system. IOPS score: 13.83 on the RDP side, 14.64 on the HDX side (lower is better). |
Summary of Test Observations
Everbody who expected a big performance boost when using Citrix HDX instead of Microsoft's RDP side-by-side protocol stack on an entry-level Cloud PC will be disappointed. This tests shows test scenarios where HDX performs better and test scenarios where RDP performs better - but many times there is no visible difference. The lack of CPU resources and low storage throughput is more significant on both sides. What's notable is that the frame rate is 30fps on the RDP side while it is 60fps on the HDX side - resulting in higher network consumption for HDX. The entry-level Windows 365 VM type under test is only suited for simple applications in a task worker scenario. Things may look very different when using larger Windows 365 Cloud PC VM types with more CPU, memory, storage and possibly GPU resources.
Test Setup Details
RDP Connection to Cloud PC
HDX Connection to Cloud PC
System Under Test: Azure West Europe, Windows 365 Enterprise, Windows 11, AMD EPYC 7763 2vCPUs @ 2.45GHz, 8GB RAM, 128GB Microsoft Virtual Disk, no GPU, Remote Desktop Services SxS Network Stack.
System Under Test: Azure West Europe, Windows 365 Enterprise, Windows 11, AMD EPYC 7763 2vCPUs @ 2.45GHz, 8GB RAM, 128GB Microsoft Virtual Disk, no GPU, Citrix HDX WS x64 7.33.3000.29.
Connection: Microsoft RDP-UDP, 12ms round trip time.
Connection: Citrix HDX, 12ms round trip time.
Endpoint: NUC2, Intel NUC 8i7HNK with Windows 11, i7-8705G CPU @ 3.10GHz, 16GB RAM, 500GB Samsung SSD 850 EVO M.2, AMD Radeon RX Vega M GL, 4GB VRAM, Windows 365 App 1.3.192.0.
Endpoint: NUC2, Intel NUC 8i7HNK with Windows 11, i7-8705G CPU @ 3.10GHz, 16GB RAM, 500GB Samsung SSD 850 EVO M.2, AMD Radeon RX Vega M GL, 4GB VRAM, Citrix Workspace App 2311.