
[EUC Score Toolset Documentation Start Page] [Build Automation v4] [Build Automation v3] [Sample Results]
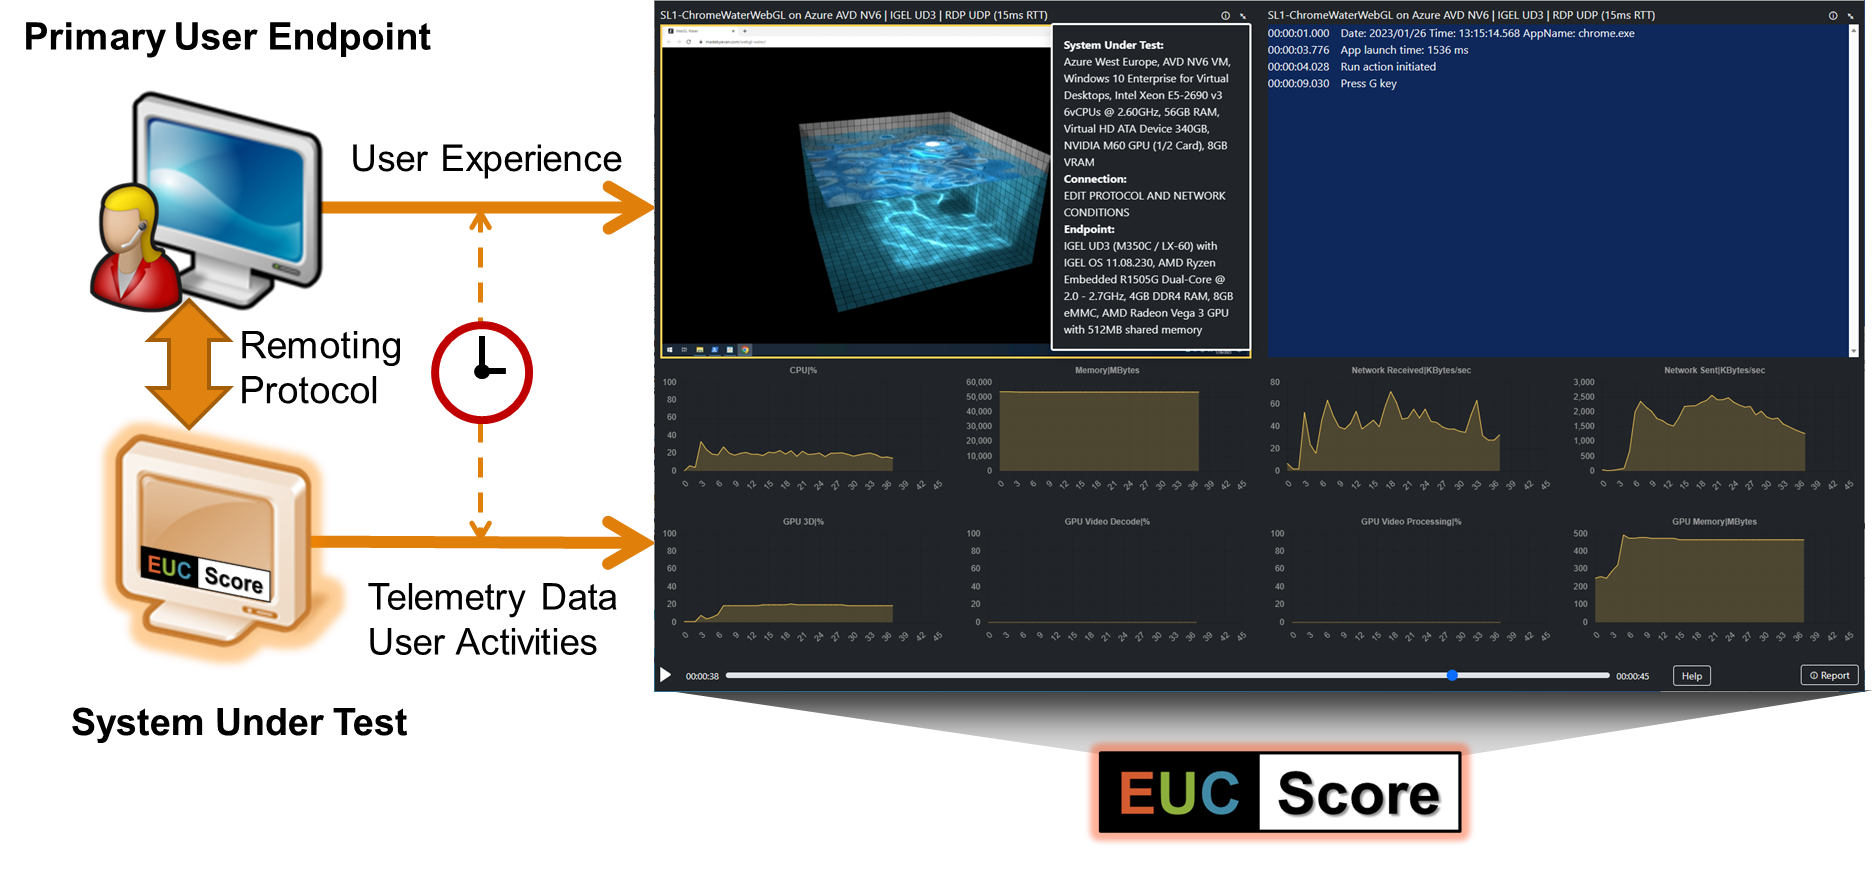
The Sync Player - sometimes referred to as Side-by-Side Player - is an HTML5 application that runs inside a browser, such as Google Chrome or Microsoft Edge. It was designed to playback videos, show system and user activities, and animate telemetry data side-by-side with a single slider control and in a synchronized fashion. The Sync Player is typically used in conjunction with datasets generated during EUC Score test runs, using screen video recorders and telemetry data collectors.
It is important to note that both the system under test and the primary user's endpoint device act as data or video sources. The two nodes may be at locations far away from each other. This is why data and file timestamps are very important for the synchronisation of the test result visualizations.
After the Installation of the EUC Score Sync Player installer package, the Sync Player templates, components, and libraries are located in the EUCScore\SyncPlayer subfolder. To build your own customized side-by-side visualizations, create new .html files using the examples as a starting point. For the build automation of complete sets of run visualizations, please refer to the build automation subchapter below.
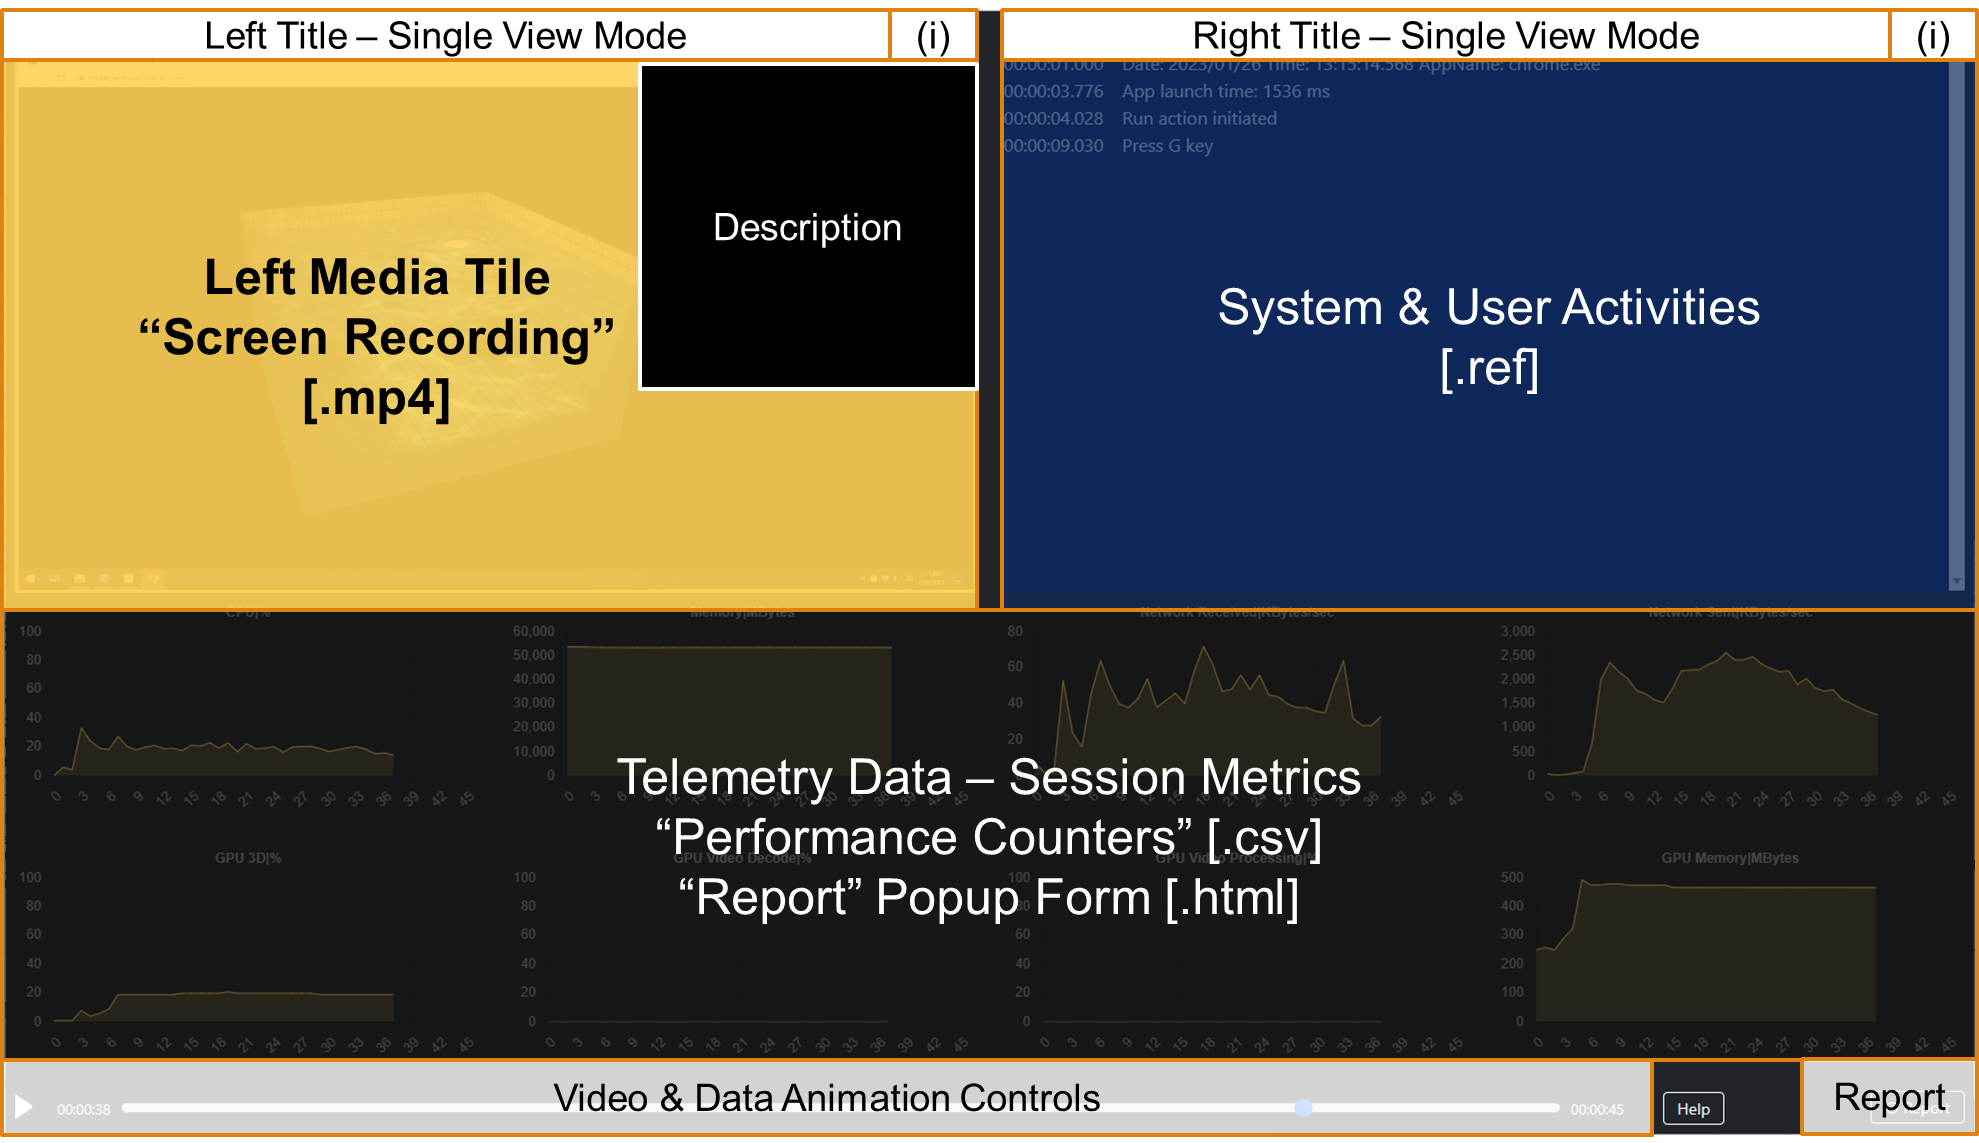
The top left media tile always includes an MP4 video (= "pacemaker" video). The top right media tile includes either another video or animated text output using .ref file data. The title bar at the top of each media tile includes one line of description text. The individual media tiles are surrounded by a border, each in a different color used for color-coding the data visualization. Important: The video aspect ratio must always be maintained.
The numerical data visualization area is located below the media tiles. It shows eight graphs with timely correlated and animated telemetry data collected on the host side. Each graph shows a title, axis labels and either one or two progressive lines. One or two .csv files created by the Avatar, the Simload Runner or any other performance data collector act as the data source for the numerical data.
The control and status bar in the footer includes video controls (play, pause and progress bar) and status information, such as elapsed time and total time. On the right side is a URL that includes the link to a help page and a button that opens or closes the report popup box.
In singe view, the Sync Player client area is divided into one foreground media output tile and one system and user activity tile on the top (each including a title bar), a numerical data visualization area at the bottom and a control and status bar in the footer.
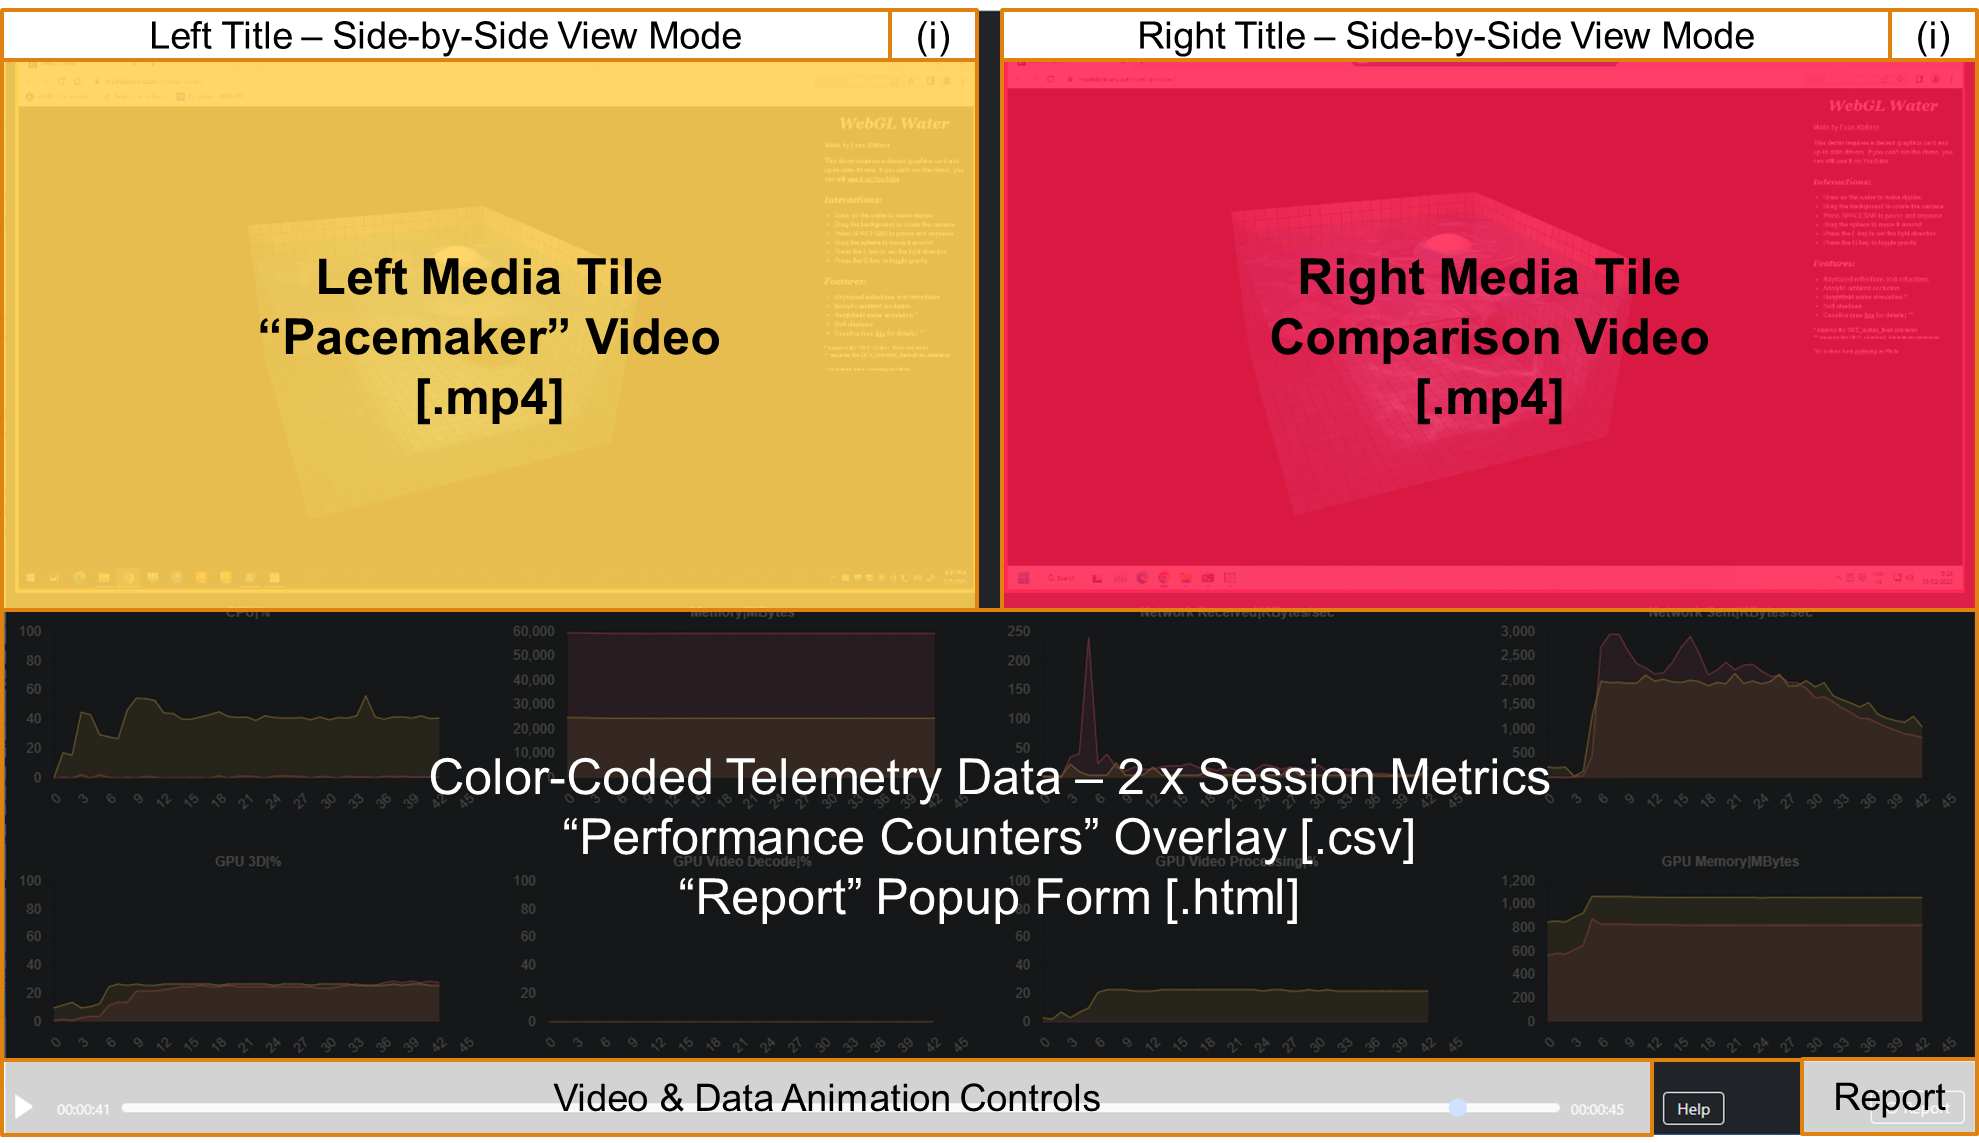
In side-by-side view (= double view), the Sync Player client area is divided into two foreground media output tiles on the top (each including a title bar), a numerical data visualization area at the bottom and a control and status bar in the footer. The progressive lines in the data charts are color-coded according to the color of the borders surrounding the media tiles.
Each test run visualization in the Sync Player is encoded as an HTML file. To avoid manual editing, there is a set of PowerShell automation scripts that can be used to create clips for individual test runs or complete test sequences. To see PowerShell script syntax details, use the Get-Help comdlet.
Steps to create Single View Clips
Steps to create Double View Clips
The Sync Player build scripts import common functions and strings from the EUCScore-PsLib-v4.psm1 module in the SyncPlayer folder. Each start of a build script including its parameters is logged in the BuildScriptLogFile.log file located in the DataFolder.
The build script Create-SimloadFolders-v4.ps1 creates the folder structure with individual Simload subfolders and a .results file in the DataFolder.
| Parameter | Description |
|---|---|
| -Datafolder | A required string parameter that specifies the full path to the test test sequence root folder that contains the full set of .mp4, .csv and .ref result files. |
| -SimloadList | An optional string parameter that specifies a .simloads file located in the SyncPlayer\_templatesX folder with a list of Simload properties. The default file name is Default.simloads. |
The Create-SimloadFolders-v4.ps1 script reads the SimloadList file which includes sections with the values of each potential Simload, such as name, search string, type, load, folder, description, and more. In case you create your own Simload, you can easily add its values to the SimloadList file.
Using the SimloadList information, the Create-SimloadFolders-v4.ps1 script creates Simload subfolders in the DataFolder, each with the associated .mp4, .csv and .ref test data files. The test data files that match a Simload search string are moved to the new Simload subfolder. Then the script creates a .results file (= ResultsFile) located in the DataFolder with all setting properties. The ResultsFile name includes the last folder name in the DataFolder string followed by the name of the SimloadList file, for example Test1-Default.results. This file name is used as an input parameter for subsequent scripts.
The general values in the [Common] section of the ResultsFile include the test sequence title (sTitle) and descriptions of the system under test (sSUT), the network connection (sConnection), and the endpoint device (sEndpoint). Modifying the iCountDownInSec and iStartDelayInMilliseconds values is optional in case the synchronization of the data visualization needs to be fine-tuned. Initially, the common values are empty or set to zero. It is recommended to enter the desired values by editing the ResultsFile. For each Simload subdirectory, the corresponding values are stored in a separate section of the ResultsFile. The values for sFindings, sRating, and sTags are initially empty and can be filled in as the clips are reviewed.
The Create-SimloadFolders-v4.ps1 script also works when the Simload subfolder structure already exists in the DataFolder, allowing it to be used multiple times in case something was changed either in the DataFolder or in a Simload subfolder.
The optional Convert-CsvFiles-v4.ps1 script is only required for non-English systems under test. The script opens the .results file, reads the .csv files associated to the Simloads and creates a backup of the .csv files. It parses through the .csv data, replaces the decimal separator and saves the results in new .csv files while maintaining their original names.
Subsequent build scripts will only run without errors if each Simload subfolder created by the Create-SimloadFolders-v4.ps1 script contains the following data files:
The build script Create-HtmlSingle-v4.ps1 creates .html files for Sync Player clips in single view mode.
| Parameter | Description |
|---|---|
| -Datafolder | A required string parameter that specifies the full path to the test test sequence root folder that contains the full set of .mp4, .csv and .ref result files. |
| -ResultsFile | An optional string parameter that specifies the name of the .results file in the DataFolder. The default name is the last folder of the DataFolder path string with a -Default suffix, for example Test1-Default.results. |
| -TelemetryFile | An optional string parameter that specifies the .telemetry file located in the templates subfolder. The default name is Default.telemetry. |
| -TelemetrySet | An optional string parameter that specifies the section name in the .telemetry file located in the templates subfolder. This section includes the names of all telemetry data headers, a prefix and the number of the charts that will be created. The default value is "All" which results in the processing of all telemetry sets in the .telemetry file. |
| -SimloadFile | An optional string parameter that specifies the .simload file located in the templates subfolder. |
| -Simload | An optional string parameter that specifies the name of the Simload if only this should be processed. The Simload selected must be in the .results file. The default value is "All" which results in the processing of all Simload folders in the .results file. |
| -Locale | An optional string parameter that specifies the language used for the HTML labels. The default value is "en-us". |
The Create-HtmlSingle-v4.ps1 script reads the ResultsFile in the DataFolder and the TelemetryFile in the template folder. It uses this information to create one or multiple Sync Player .html files in a single Simload setup. If no TelemetrySet argument is provided, all possible .html files with the corresponding telemetry sets are created. The optional Simload argument can be used if for creating the .html files for only one Simload.
The TelemetryFile includes a section for each TelemetrySet. The associated values are prefix string, number of charts and a header string for each performance counter. If a header string cannot be found in the .csv file, all values are set to zero for this performance counter.
Each test run visualization in the Sync Player is encoded as an HTML file. To avoid manual editing, there is a set of build automation PowerShell scripts for an entire test sequence. To see PowerShell script syntax details, use the Get-Help comdlet.
Single View
Double View
The Sync Player build scripts import frequently used functions and strings from the EUCScore-PsLib.psm1 module in the root folder. Each start of a build script including its parameters is logged in the BuildScriptLogFile.log file located in the test run target folder.
It is possible to run each build script multiple times. In the case of .ini build scripts, the first run creates a new .ini files with default values. Any subsequent run will inherit the values of the existing .ini file and create a backup file with a timestamp.
The build scripts were used to create the Sample Results
At the beginning, each test sequence is represented by a dedicated root folder where all dataset files of the test sequence need to be located. This root folder must also include a _libsX subfolder with Java Script libraries (bootstrap, chart, jquery) and CSS files. Another prerequisite is a _templatesX sub folder with .html templates used by the PowerShell build scripts. The X in the subfolder names represents the version.
The first build script creates a separate subfolder for each test run in the root folder and moves all data files that belong to a test run from the root folder to its subfolder. Each subfolder name corresponds to the name of the respective Simload, for example SL1-DominoOpenGL.
| Parameter | Description |
|---|---|
| -Datafolder | A required parameter that specifies the full path to the test run root folder that contains the full set of .mp4, .csv and .ref result files. |
Subsequent build scripts only run without errors if each test run subfolder contains the following data files:
If any of the prerequisites is not met, the PowerShell scripts may fail and throw error messages. With all result files of a test sequence in one single root folder, the Create-SimloadFolders script builds the correct subfolder structure.
In Single View Mode, Sync Player shows a top left tile that contains a test run screen video and a top right tile with animated text representing timely correlated user activities and session runtime details. The numerical data visualization area shows animated telemetry data collected on the host side.
The Create-IniSingle script creates an .ini file in the test sequence root folder. In the example below, the data folder is named TestRun1 und the .ini file is named TestRun1.ini.
| Parameter | Description |
|---|---|
| -Datafolder | A required parameter that specifies the full path to the test run root folder that contains the full set of .mp4, .csv and .ref result files. An example is d:\EUCScore-Results\Sequence1. |
| -IniFile | A required parameter that specifies the name of the .ini file that is created in the DataFolder folder. An example is Sequence1.ini. |
| -LengthInSec | An optional parameter that specifies the lenght of each test run in seconds. Default is 45. |
| -CountDownInSec | An optional parameter that specifies the lenght of the countdown in seconds before the test run starts. The number of countdown seconds is later added to the timestamps in the .csv files. Default is 1. |
NOTE: Check out the syntax of the script with Get-Help .\Create-IniSingle.ps1
The resulting .ini file automatically opens in a text editor, allowing to change the "EDIT..." values in the [Specs] and [Common] sections.
Add findings and comments specific to a test run to the ReportFindings, ReportTableCommentLeft and ReportTableCommentRight keys. These strings will be inserted into the Simload-specific report files.
IMPORTANT: Make sure that Header values in the [Telemetry*] sections reflect the headers in the CSV telemetry files.
The Create-CsvNormalized script converts telemetry files in each Simload subfolder into normalized .csv files. It reads the raw telemetry files and creates new .csv files with a predefined structure in preparation for the filtering in the next step.
| Parameter | Description |
|---|---|
| -Datafolder | A required parameter that specifies the full path to the test run root folder that contains the full set of .mp4, .csv and .ref result files. An example is d:\EUCScore-Results\Sequence1. |
| -IniFile | A required parameter that specifies the name of the .ini file that is created in the DataFolder folder. An example is Sequence1.ini. |
The Create-CsvSingle script uses the keys in one of the the [Telemetry] sections to create new .csv files in each SL* subfolder, adding the prefix STD or GPU to the file names. These new .csv files only include the selected columns.
In the [Telemetry] sections, the value of Header0 is always TimeStamp|1000. The values of Header1 through Header8 (or Header12) must match the EXACT string of a column header in the .csv files. Please check if the column headers configured in [Telemetry8Std] and [Telemetry8GPU] really exist, otherwise the script will break when trying to create STD and GPU .csv files.
| Parameter | Description |
|---|---|
| -Datafolder | A required parameter that specifies the full path to the test run root folder that contains the full set of .mp4, .csv and .ref result files. An example is d:\EUCScore-Results\Sequence1. |
| -IniFile | A required parameter that specifies the name of the .ini file that is created in the DataFolder folder. An example is Sequence1.ini. |
| -Telemetry | An optional parameter that specifies the section name in the .ini file with csv format settings. Default is Telemetry8Std. |
After running these scripts successfully, you'll find new STD-*.csv and GPU-*.csv files in each SL1 subfolder.
The Create-HtmlSingle script uses the templates, the .ref files and the new .csv files to create an individual .html file for each test run in a SL* subfolder.
| Parameter | Description |
|---|---|
| -Datafolder | A required parameter that specifies the full path to the test run root folder that contains the full set of .mp4, .csv and .ref result files. An example is d:\EUCScore-Results\Sequence1. |
| -IniFile | A required parameter that specifies the name of the .ini file that is created in the DataFolder folder. An example is Sequence1.ini. |
| -Telemetry | An optional parameter that specifies the section name in the .ini file with csv format settings. Default is Telemetry8Std. |
In addition, the script creates a LinkList-STD-Foldername.html or LinkList-GPU-Foldername.html file in the Simload root folder.
IMPORTANT: Building the Sync Player single view HTML files requires the _template3 folder with the HTML templates to be located in the same root folder as the PowerShell build scripts. The _libs3 folder is also located in the root folder. It contains all CSS and JavaScript files that are needed during the runtime of a Sync Player clip. The relative path of this library folder must always be maintained. If this is not the case, the clips will not start.
In Side-by-Side View Mode, both top tiles include test run screen videos with a yellow border on the left side and a red border on the right side. The numerical data visualization area shows animated telemetry data collected on the host side and color-codeed according to the video border colors.
Prerequisite is TWO data folders with their respective single view .ini files. The Create-4IniDouble-8Charts script creates a new data folder with its side-by-side .ini file.
| Parameter | Description |
|---|---|
| -RootFolder | A required parameter that specifies the path to the root folder which includes the testrun folders. An example is C:\Results. |
| -SourceIniPath1 | A required parameter that specifies the path to source .ini file 1, relative to the RootFolder path. An example is NUC2\NUC2.ini. |
| -SourceIniPath2 | A required parameter that specifies the path to source .ini file 2, relative to the RootFolder path. An example is Dungeon3\Dungeon3.ini. |
| -TargetName | A required parameter that specifies the path to the new target .ini file and its name, relative to the RootFolder path. An example is NvsD. |
| -Prefix | An optional parameter that specifies the prefix for the target folder name. Default is SxS. The resulting folder and .ini file name is SxS-NvsD\NvsD.ini. |
The script reads the key/value pairs of the two .ini files into two hash tables that are used for filling the new .ini file. Side-by-side Simload comparisons are only created when the names match, all other Simloads are ignored.
Please review and if needed edit the resulting .ini file, in particular Simload-specific findings and comments as they are empty after the .ini file was created for the first time. It is a common practice to create the HTML files from the initial .ini file, review the Sync Player clips, add Simload-specific findings and comments to the .ini file, and create the HTML files again.
The Create-5HtmlDouble script uses the templates and the .csv files to create an individual .html file for each side-by-side comparison.
| Parameter | Description |
|---|---|
| -Rootfolder | A required parameter that specifies the full path to the test run root folder. An example is d:\EUCScore-Results\Sequence1. |
| -IniPath | A required parameter that specifies path and name of the .ini file that includes all configuration settings. An example is SxS-NvsD\NvsD.ini. |
| -Telemetry | An optional parameter that specifies the section name in the .ini file with csv format settings. Default is Telemetry8Std. |
In addition, the script creates a LinkList-STD-SxS-Foldername.html or LinkList-GPU-SxS-Foldername.html file in the SxSPlayer root folder.
The Export-SyncPlayerClip.ps1 script exports one or all test sequence clips and the runtime libraries to a target folder structure...
| Parameter | Description |
|---|---|
| -IniPath | A required parameter that specifies path and name of the .ini file that includes all configuration settings. An example is d:\EUCScore-Results\Sequence1\SxS-NvsD\NvsD.ini. |
| -ExportPath | A required parameter that specifies the path that is the target of the export. An example is d:\Export. |
| -Simload | An optional parameter that specifies the Name of an individual Simload. An example is SL1-NotepadEdit. |
| -IncludeAll | A switch parameter. If set, all Sync Player clips in the .ini file are exported. |
The files in the export folder represent one or multiple fully functional Sync Player clips. No .csv or .ref files are included. The full export folder with all subfolders and files can be copied to a target folder on a Windows PC, a Mac or a webserver. It is important that the folder structure stays intact. If not, it breaks the Sync Player clips.
A number of additional PowerShell scripts are provided for post-production purposes.