[EUC Score Toolset Documentation Start Page] [Tools Included in the Simload SDK]
The supplementary tools are functioning in a supporting capacity. Typically they add specific functionalities or they extend the EUC Score scope and the range of use cases.
All supplementary tools and configuration files are located in the Tools folder or in the Tools\Telemetry subfolder.
Data Miner is part of the EUC Score Base Package and it is also available as a stand-alone download package. It combines several supplementary tools from previous EUC Score versions, such as Startup Simload, Telemetry Tracker, Telemetry Splash and Telemetry Spy. Use cases for Data Miner are storing inventory data, collecting telemetry data for a configurable time while manually interacting with test applications, automatically running applications on user logon, and establishing a system-wide "flight data recorder" allowing for digital forensic investigations. By default, on double-click or when launched from the command line, Data Miner reads the Telemetry.ini configuration file in the telemetry subfolder and opens in GUI mode.

The functionalities behind menu items and buttons are as follows:
Data Miner writes all collected telemetry, system and inventory data files into the results folder. The location of the results folder is either defined by registry setting (HKEY_LOCAL_MACHINE\Software\EucScore\Folders\Results or HKEY_CURRENT_USER\Software\EucScore\Folders\Results) or by existence of the .\..\Results\ folder. If none of these exist, then the data files are stored in the Public Documents\EUCScore\Results folder. The Public Documents folder is typically located at C:\Users\Public\Documents. You can always check the current location of the results folder by opening the About dialog.
When running DataMiner.exe with the -nogui parameter from the command line, it doesn't show a graphical user interface. If no other parameter is provided, the settings in Telemetry.ini are applied. The collection of telemetry data can be stopped from the command line by running DataMinerStop.exe. Additional Data Miner parameters can either assign a new configuration file or overwrite settings, both in GUI mode or in CMD mode.
| Parameter | Description |
|---|---|
| -nogui | Run DataMiner.exe without GUI (= CMD mode) |
| -inifile | Configuration file in INI format. If this INI file is not found, default values are used (default: Telemetry.ini) |
| -maxcycles | Number of cycles telemetry data is collected, defined in the [PerfCounters] section of the INI file (default: 45) |
| -countdown | Number of seconds before the telemetry data collection starts. If greater than 0, then show a visible countdown in the top left corner of the default screen (default: 0) |
| -extra | A string that is added to the name of CSV output files containing the collected telemetry data. |
| -processes | Collects the number of processes defined in the [Processes] section of the INI file |
| -trigger | Defined in the [Trigger] section of the INI file. Collects CPU consumption of all processes when counter value is greater than threshold, then sleeps for # of cycles |
| -activityrecorder | Collects mouse and keyboard activities and writes them to a REF file if enabled |
| -apppath | Runs the application specified |
| -appparam | Optional application command-line parameters |
| -getinfo | Ignores all other parameters and writes system information and inventory files to the results folder. |
An INI-based configuration file for Data Miner consists of plain text with a structure and syntax comprising key-value pairs organized in sections. A line that starts with "#" is commented out. Empty lines are also removed. The "Setting" column in the table below represents the label in the Data Miner GUI or the friendly name.
| Setting | INI Section | INI Key | Description |
|---|---|---|---|
| Max. Cycles | Common | MaxCycles | Maximum number of cycles. Default is 45. |
| Interval | Common | IntervalInSec | Interval in seconds between cycles. Default is 1. |
| Countdown | Common | CountDown | Number of seconds until application starts. A small label in the top left corner of the default monitor shows the remaining seconds. Default is 0 (no). |
| AutoRun | Common | AutoRun | On Data Miner launch, immediately start the data collection according to the settings in the configuration file. Default is 0. |
| Hide GUI | Common | Hide | Hide the GUI while collecting telemetry data. |
| Cycle # | -- | -- | Current cycle number. Constantly updated in the GUI when telemetry data is being collected. |
| Counters | PerfCounters | Enabled | Collects performance counters in the list if enabled. Default is 1 (yes). |
| Processes | Processes | Enabled | Collects the number of processes in the list if enabled. Default is 0 (no). |
| Trigger | Trigger | Enabled | Collects CPU consumption of processes when counter value is greater than threshold. Default is 0 (no). |
| Sleep Cycles | Trigger | SleepCycles | Number of sleep cycles after data collection was triggered. Default is 30. |
| CPU Counter | Trigger | CpuCounter | CPU counter number in the PerfCounters section. Default is 1. |
| CPU Threshold | Trigger | CpuThreshold | CPU threshold in percent. Default is 90. |
| IOPS Counter | Trigger | IopsCounter | IOPS counter number in the PerfCounters section. Default is 7. |
| IOPS Threshold | Trigger | IopsThreshold | IOPS threshold. Default is 1000. |
| Process Counter | Trigger | ProcCounter | Process counter number in the PerfCounters section. Default is 10. |
| Process Threshold | Trigger | ProcThreshold | Process threshold. Default is 1000. |
| Activity Log | ActivityRecorder | Enabled | Collects mouse and keyboard activities and writes them into a REF file. Default is 0 (no). |
| App Launch | RunApp | Enabled | Runs application or Simload if enabled. |
| App Name | RunApp | FullAppPath | Full path and name of the application. |
| App Param | RunApp | AppParam | Application command-line parameters. |
| Driver Info | Inventory | DriverInfo | Collect driver information and store data in a CSV file. |
| Service Info | Inventory | ServiceInfo | Collect Windows Service information and store data in a CSV file. |
| User Sessions | Inventory | UserSessions | List current user sessions and store data in a CSV file. |
| Proc Info | Inventory | ProcInfo | Collect currently running process details and store data in a CSV file. |
| Session Proc Info | Inventory | SessionProcInfo | Collect process details in session context and store data in a CSV file. |
| Proc Times | Inventory | Trigger | Collect current process CPU load as if triggered and store data in a CSV file. |
| Task List | Inventory | TaskList | Collect process details similar to Task Manager and store data in a CSV file. |
| Win Info | Inventory | WinInfo | Collect window details and store data in a CSV file. |
| Win Events | Inventory | Events | List RDS-relevant events of the last 24 hours and store data in a CSV file. |
Use Case 1: Collecting telemetry data can be initiated by a simple click on the Start Data Collection button. The performance counters, the maximum number of cycles, the interval in seconds, the countdown and all other optional settings can be modified in the configuration file. This is the most popular Data Miner use case.
Use Case 2: Collecting system information or inventory data only requires a click on the respective menu items SysInfo or Inventory. The resulting data files are stored in the results folder. They can be viewed through a click on the Results menu item which opens an Open Result File dialog box which filters by either .csv or .txt file extension.
Use Case 3: Launching an application or Simload on user logon is another Data Miner use case. This can be very helpful if a synthetic or "noisy neighbor" user session was initiated by a logon simulator or by a scripted remoting client software. Requirements are the correct settings of the Enabled, FullAppPath and AppParam values in the RunApp section of the configuration file and the creation of a shortcut to DataMiner.exe -nogui in C:\ProgramData\Microsoft\Windows\Start Menu\Programs\StartUp.
Use Case 4: The "flight data recorder" mode can be enabled by launching Data Miner in a system context from Task Scheduler. The trigger can be on a daily schedule with a start time in the morning or at startup of the system. The program that is started on the trigger is DataMiner.exe with the -nogui argument. Another optional argument is -inifile followed by a custom configuration file for this purpose. If you set the values in IntervalInSec to 10 and in MaxCycle to 3600, DataMine collects telemetry data for 10 hours. This data can be used for digital forensic investigations or post-mortem analytics.
The Telemetry Editor is used to show or modify performance counters configured in Telemetry.ini and similar files. It allows you to modify an existing telemetry configuration file or to create a new telemetry configuration file ("Clone").
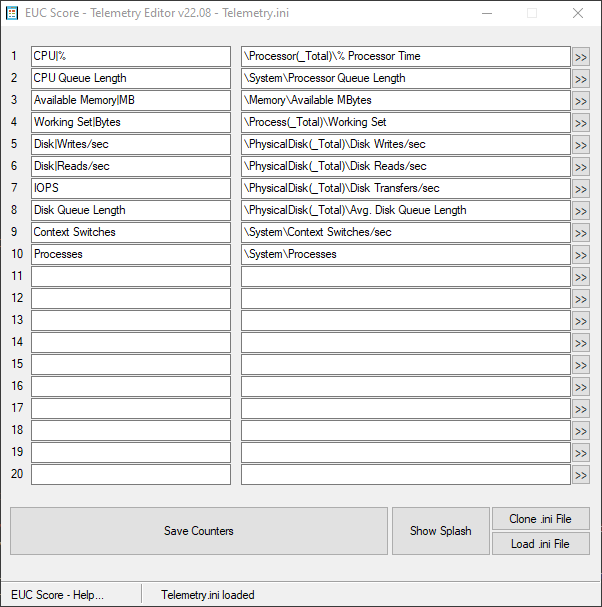
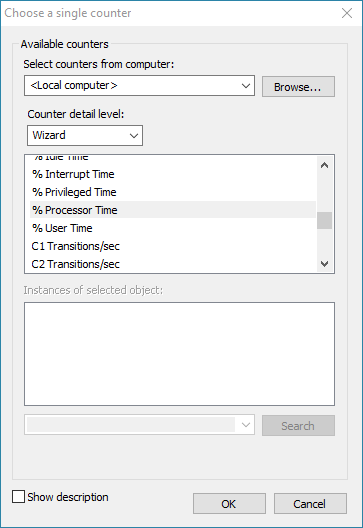
Use a ">>" button on the right side to select a new performance counter. NOTE: Only single-instance performance counter types are supported (no multi-instance types, such as <All Instances> or *).
The Telemetry Editor can be launched from the Simload Runner.
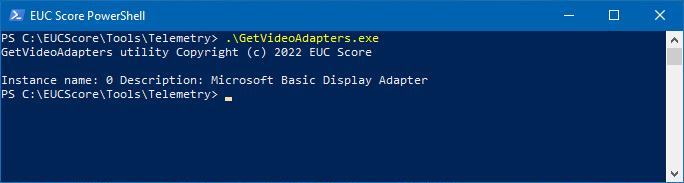
GetVideoAdapters in the Tools\Telemetry folder is a command-line tool that shows the video adapters that are visible for the Telemetry Collector included in the Avatar.
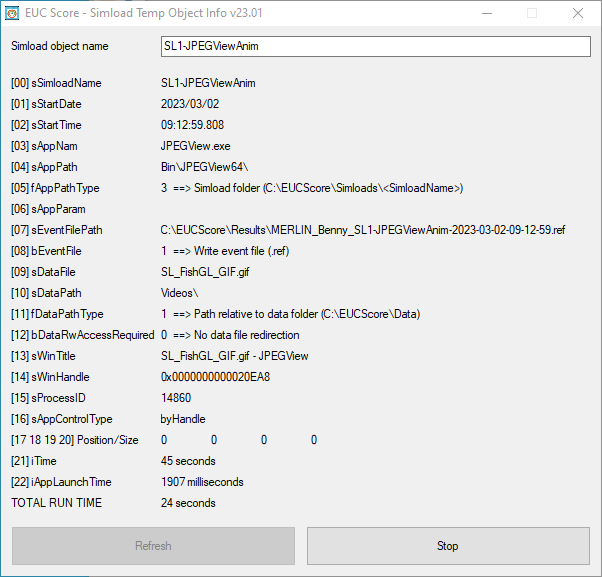
TempObjectInfo shows the temporary object that is created in the registry when running a Simload. This is helpful when creating new Simloads.
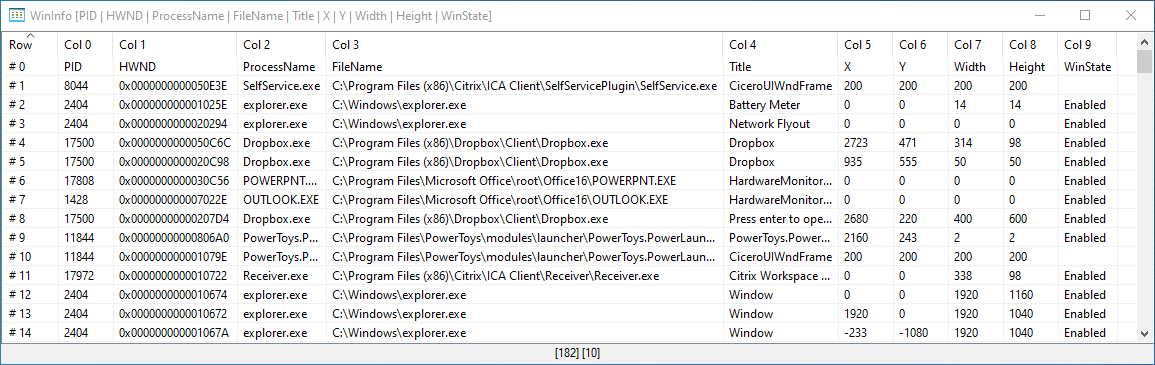
WinInfo shows process ID, window handle, process name, file name, window title and window position of each application currently running in the user session. The underlying methods to retrieve this data are identical to the methods used in simloads. The displayed information can be very useful when modifying a side-by-side .ini file.
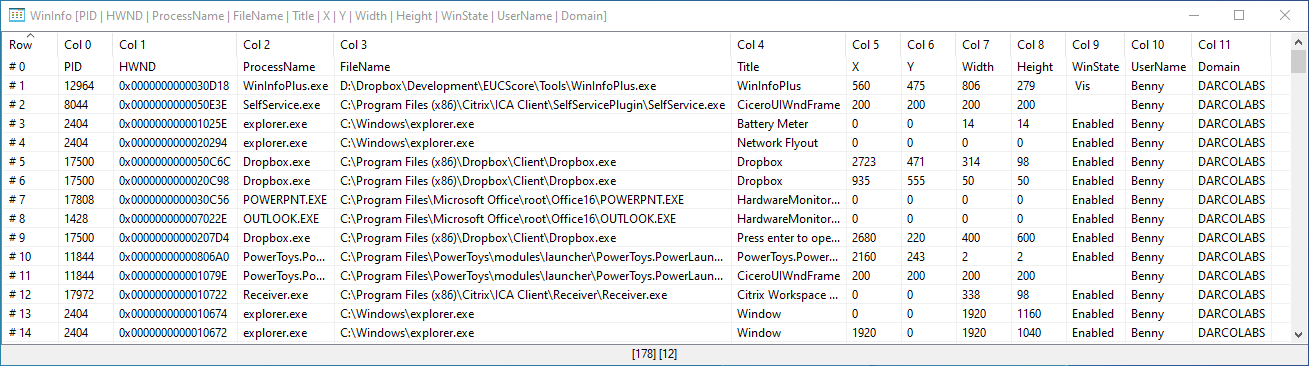
WinInfoPlus shows process ID, window handle, process name, file name, window title, window position, window state, user name and domain of each application currently running in the user session.
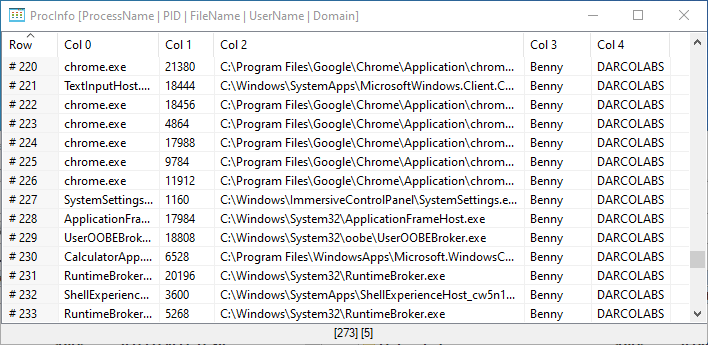
ProcInfo shows process name, process ID, file name, user name and domain of each process visible from the user session.
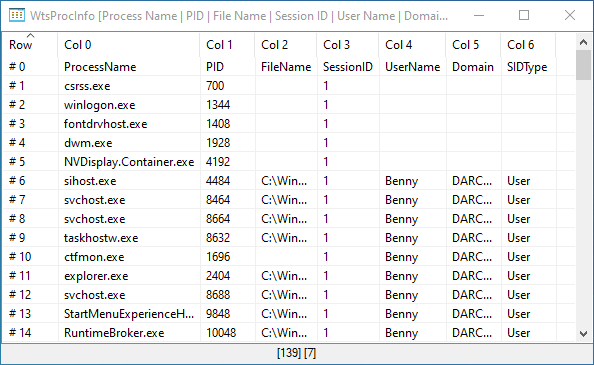
WtsProcInfo uses the Windows Terminal Server API to show process name, process ID, file name, session ID, user name, domain and SID type of each process visible from the user session.